The following summary information is a synopsis of and direct excerpts from the National Estuary Program Open File GBNEP-31, April 1993, Trends and Status of Wetlands and Aquatic Habitats in the Galveston Bay System, Texas by William A. White, Thomas A Tremblay, and E.G. Wermund, Jr., and Lawrence Handley.
Table 1 Areal extent of wetland systems and uplands
Table 2 Status (1989) of major estuarine and palustrine systems
Figure 2 Current Status of Galveston Bay habitats
Figure 3 Areal extent of vegetated wetlands 1989
Figure 4 Areal extent of upland habitats in 1989
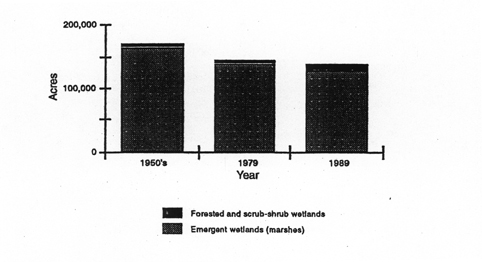
Figure 5 Trends in marshes and forested sand scrub-shrub wetlands in the Galveston Bay systems
Trends: 1950's to 1979 to 1989
Table 3 Status (1989) of major estuarine and palustrine systems
Table 4 Status (1989) of major estuarine and palustrine systems
Description of Wetlands for the Virginia Point Area
Probable Cause of Wetland Change in Virginia Point area
Figure 7 Land surface subsidence in the Galveston Bay area, 1906 to 1987
Figure 8 Relationship between subsidence and losses in the Virginia Point quad
Figure 9 Distribution of emergent habitats in the Virginia Point quad
Conversion of Wetlands to Uplands
Texas City/ Virginia Point
Wetland and aquatic habitats are essential biological components of the Galveston Bay Estuarine System. Understanding the spatial and temporal distribution of these habitats is critical if they are to be effectively protected and managed. This report presents results of an investigation sponsored by the Galveston Bay National Estuary Program (GBNEP) to determine the trends and status of wetlands and aquatic habitats in the Galveston Bay system through aerial photographic analysis supported by field surveys.
Status and trends of wetlands in the Galveston Bay system were determined by analyzing the distribution of wetlands mapped on aerial photographs taken in the 1950's, 1979, and 1989. Wetlands for all maps were delineated on photographs through stereoscopic interpretation using procedures developed for the U.S. Fish and Wildlife Service (USFWS) National Wetlands Inventory program. Field reconnaissance was an integral part of the interpretation process. Wetlands were classified by systems (marine, estuarine, riverine, palustrine, lacustrine), subsystem (reflective of hydrologic conditions), and class (descriptive of vegetation and substrate). Data for 1979 and 1989 were additional classified by subclass (subdivisions of vegetated classes only), water-regime, and special modifiers.
More than 180 field sites were examined as part of the effort to characterize wetland plant communities and define wetland map units in the Galveston Bay system. Topographic surveys were conducted along several transects. County soil surveys were used to define and characterize soils and the various field check sites.
Status of Wetland Habitats: 1989
Wetlands and aquatic habitats are dominated by an estuarine system that encompasses approximately 507,500 acres (table 2.1) in the 30 7.5-minute quadrangles that make up the Galveston Bay study area (figure 2.1). Major estuarine and palustrine habitats include salt, brackish, and fresh marshes, forested and scrub-shrub wetlands, subtidal aquatic beds, intertidal flats, and estuarine open water (table 2.2). Vegetated wetlands (marshes, scrub-shrub, and forested wetlands) have a total area of about 136,600 acres, or 13 percent of all habitats (figure 2.2). Marshes, or estuarine and palustrine emergent wetlands, cover approximately 130,400 acres, representing about 94 percent vegetated wetlands. Estuarine emergent wetlands (salt and brackish marshes) are the most extensive wetlands in the study area (figure 2.3). The most extensive upland habitat is rangeland (figure 2.4).Table 1. Areal extent of wetland systems and uplands.
| Wetland Systems
|
Acres
|
| Estuarine | 507,500 |
| Palustrine | 34,100 |
| Lacustrine | 21,600 |
| Riverine | 3,000 |
| Marine | †2300 |
| Uplands | 498,900 |
†Excludes marine open water. |
|
Figure1: Study area defined by 30 USGS 7.5 minute series and location of WETMAAP Texas City/Virginia Point site.
Table 2: Status (1989) of major estuarine and palustrine habitats.
Estuarine Intertidal Emergent Wetlands (Salt and Brackish Marshes)
Most extensive wetland habitat in the study area
108,200 acres of salt and brackish marshes
Composes 75% of vegetated wetlands* and 83% of the habitats (emergent wetlands)
Estuarine Intertidal Unconsolidated Shores
Intertidal flats and beaches
17,800 acres in Galveston Bay system
Extremely low tides when photographs were taken caused many areas that would normally have been submerged to be mapped as flats instead of open water
Estuarine Intertidal Scrub/Shrub Wetlands
550 acres total with most quads having less than 50 acresMorgans Point and Virginia Point each have about 100 acres
Estuarine Aquatic Beds
700 acres of submerged vascular vegetation in Galveston Bay system proper
(excluding smaller inland water bodies and misinterpreted areas)
Largest area (386 acres) in Christmas Bay; remainder along margins of upper
Trinity Bay
Estuarine Subtidal Unconsolidated Bottom
Palustrine System378,200 acres of open water (65% of study area)Includes Galveston, Trinity, East, West, Christmas, and Chocolate Bay, etc
.
Palustrine Emergent Wetlands (Fresh, or Interior, Marshes)
22,200 acres (16% of vegetated wetlands and 17% of marsh habitats)
Most extensive distribution is along the Trinity River alluvial valley and inland of
Christmas, West, and East Bays
Palustrine Scrub/Shrub Wetlands
2,000 acres (1.4% of vegetated wetlands)Largest acreages (>300 acres each) occur in Dickinson and Highlands quads
Most quads have less than 100 acres
Palustrine Forested Wetlands
5,648 acres (4% of vegetated wetlands)
Most abundant in Trinity River valley; other notable quads include Oyster Creek, Highlands, and Hitchcock
*Vegetated wetlands as used in this trade do not include aquatic beds
Status (1989) of Galveston Bay Habitats
Total acreage: 1,066,00
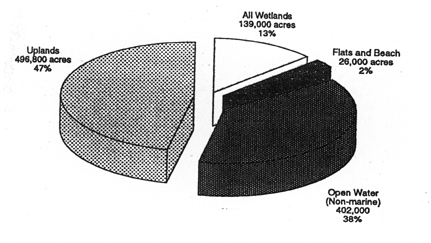
Figure 2: Current status of Galveston Bay habitats
Extent of Vegetated Wetlands in 1989
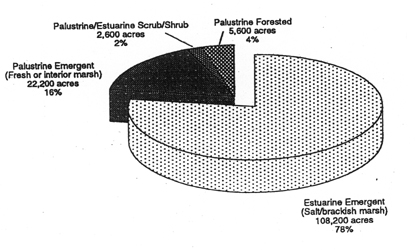
Figure 3: Areal extent of vegetated wetlands in 1989
Upland Habitats in 1989
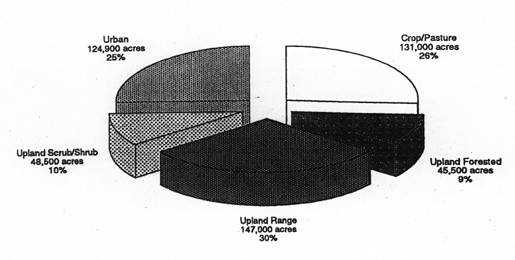
Figure 4: Aerial extent of upland habitats in 1989
Wetland Habitat Trends for Galveston Bay
Trends : 1950's to 1979 to 1989
There were gains and losses in wetlands form the 1950's to 1989, but the net trend was one of wetland loss. This downward trend is illustrated by acreages of 171,000 in the 1950's, 146,000 in 1979, and 138,600 in 1989 (table 2.4 and figure 2.5). The rate of loss, however, decreased over time from about 1,000 acres per year between 1953 and 1979, to about 700 acres per year between 1979 and 1989. The rate of loss for the period 1979 to 1989 would be lower (<500 acres/yr) if inaccuracies in wetland interpretation on the 1979 photographs are taken into account. In general, scrub-shrub habitats decreased in area from the 1950's to 1979 and 1989 while forested wetlands increased (table 2.3).
Overall trends and Their Probable Causes: 1950-1989
In analyzing trends, emphasis was placed on wetland classes and not on water regimes and special modifiers. Emphasis is placed on net losses in wetlands. Losses in wetland vegetation resulted from conversion of the wetlands to (1) open water and flats, (2) uplands, and (3) other wetlands classes. From the 1950's to 1989, there was a net loss in vegetated wetlands of 32,400 acres, which amounts to 19 percent of the vegetated wetland system that existed in the 1950's.
Estuarine and Palustrine Emergent WetlandsThe area emergent wetlands (marshes) decreased from about 165,500 acres in the 1950's to about 130,400 acres in 1989, producing a total net marsh loss of approximately 35,100 acres, or 21 percent of the 1950's resource. Like vegetated wetlands, this amount of loss in emergent wetlands is thought to be on the high side; the actual lost is probably below 19 percent.
Net losses in vegetation occurred in 25 of the 30 quadrangles (quads) studied. The most substantial losses occurred in the southwest part of the study area and include Virginia Point, Hitchcock, Hoskins Mound, Texas City, and Sea Isle. Approximately 55 percent of the total losses of emergent vegetation in the Galveston Bay System occurred in these areas. The most extensive net loss, exceeding 5,000 acres, occurred in the Virginia Point quad in the inland margin of West Bay.
The causes of wetland loss include both natural and artificial processes. Among them are humanly induced subsidence and relative sea-level rise, and draining and filling of wetlands for agricultural, transportational, industrial, residential, and commercial purposes (table 2.4). Major losses in estuarine emergent wetlands (salt and brackish marshes) occurred as they were converted to open water and barren flats. Major losses in palustrine emergent wetlands (interior, or fresh marshes) resulted from their conversion to uplands.
Although the net loss in emergent wetlands (marshes) from the 1950's to 1989 encompassed about 35,000 acres, the gross loss, exclusive of offsetting gains in other areas, was considerably larger--approximately 88,500 acres. Conversion of emergent wetlands to open water and flats exceeded 26,400 acres, accounting for about 30 percent
Table 3: Areal extent of vegetated wetlands and aquatic beds in the 1950's, 1979, and 1989.
| Wetland Type | Area (acres) | ||
| 1950's | 1979 | 1989 | |
| Estuarine and Palustrine Emergents (marshes) |
165,500 | 138,130 | 130,370 |
| Scrub/Shrub | 3,430 | 2,300 | 2,570 |
| Forested | 2,040 | 5,580 | 5,650 |
| Total | 170,970 | 146,010 | 138,590 |
| Estuarine Subtidal Aquatic Beds |
2,500 | N/A | 700 |
Table 4: Major causes of wetland losses from the 1950's to 1989.
| Cause of Emergent Wetland (Marsh) Loss | Acres Lost |
| Conversion to open water and flat principally due to subsidence and relative sea-level rise |
26,450 |
| Conversion to Uplands | |
| Upland Range | 25,000 |
| Upland Urban | *5,700 |
| Upland Agriculture | 3,600 |
| Upland Spoil | 1,500 |
| Total Conversion to Uplands | **35,800 |
of the total gross loss. There is evidence that humanly induced subsidence and associated relative sea-level rise was the major factor contributing to the conversion of marshes to open water and barren flats (table 2.4). Subsidence along active surface faults contributed to marsh loss in some areas.
Major losses in interior, or fresh, marshes occurred as large areas of palustrine emergent wetlands were transformed to uplands. The magnitude of this change is approximately 35,600 acres from the 1950's to 1989, and accounts for about 40 percent of the total gross loss in palustrine and estuarine emergent wetlands. The change from emergent wetlands in the 1950's to upland rangeland in 1989 encompassed 25,400 acres. Conversion of wetlands to urban upland areas amounted to 5,700 acres, and to cropland and pastureland, 3,600 acres (table 2.4). It appears that some changes are related to natural conditions, such as annual (and seasonal) changes in moisture levels, which affected photointerpretation, but a substantial amount of the changes appears to be due to draining of wetlands. This has been a common practice, especially from 1950's to 1970's. Approximately 33 percent of the gross loss is emergent wetlands is attributed to conversion of marshes to upland rangeland and cropland.
Losses in emergent wetlands in some areas were partly offset by gains in emergent wetlands in other areas. Conversion of uplands to emergent wetlands accounted foe an increase of about 21,000 acres. Regionally, these changes were most pronounced inland from East, West, and Christmas Bays. The conversion of uplands to wetlands generally took place in traditional areas peripheral to existing wetlands, and appears to be related to subsidence and associated relative sea-level rise in some areas. Additional increases in emergent wetlands resulted from the spread of emergent vegetation across intertidal flats. However, the replacement of vegetated areas by flats was a much more significant process
Although vegetated wetland expansion may have partially offset wetland losses in terms of acreage, this offset does not necessarily apply in terms of overall functional value. There is evidence that newly created wetlands are not functionally equivalent to older, long-established wetlands.
Scrub-Shrub and Forested Wetlands
The general trend in scrub-shrub wetlands for the 1950's to 1989 period was one of net loss. However, this trend was countered by forested wetlands, which had a significant net gain. Scrub-shrub wetlands decreased by approximately 850 acres, representing a loss of about 25 percent of the 1950's resource. Forested wetlands, on the other hand, increased in area by approximately 3,600 acres, an increase of about 1.8 times the 1950's area. Much of this gain in forested wetlands was due to (1) taller growth of shrubs and trees in areas previously mapped as scrub-shrub wetlands and (2) inconsistent delineation of forested wetlands on the different sets of photographs. Locally, losses in forested wetlands were due to alterations in hydrology.
Description of Wetlands for the Virginia Point Area.
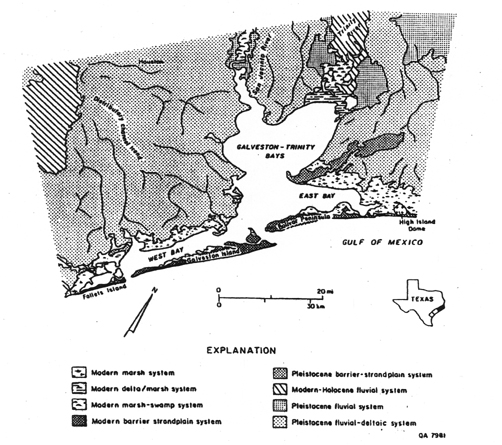
The geologic framework of the Galveston Bay area consists of Modern-Holocene and Pleistocene systems including the modern wetland, or marsh and marsh-swamp systems (figure 2.6). The geomorphic features on which the various types of coastal wetlands have developed are the result of numerous interacting processes. Physical processes that influence wetlands include rainfall, runoff, fluctuations in the water table, streamflow, evapotranspiration, waves and longshore currents, astronomical and wind tides, storms and hurricanes, deposition and erosion, subsidence, faulting, and sea-level rise (table 2.5). These processes have contributed to the development of a gradational array of permanently inundated to infrequently inundated environments ranging in elevation from submerged lands of the estuarine system through the typographically higher wetland system, which grades upward from the astronomical-tidal zone through the wind-tidal zone to the storm-tidal zone.
Exchange of marine waters with bay-estuary-lagoon waters in the Galveston Bay system occurs primarily through two major tidal inlets, Bolivar Roads at the north end of Galveston Island, and San Luis Pass at its south end (figure 2.6). Additional exchange occurs at Rollover Pass, a narrow dredged channel at the east end of Bolivar Peninsula. The predominant sources of fresh-water inflow are the Trinity and San Jacinto Rivers (figure 2.6).
These numerous interacting processes in the Galveston Bay system have a major bearing on the location and composition of wetland plant communities.
The estuarine system consists of many types of wetland habitats. Estuarine subtidal unconsolidated bottom (E1UBL), or open water, occurs in the numerous bays and in adjacent salt and brackish marshes. Unconsolidated shore (E2US) includes intertidal sand and mud flats and estuarine beaches and bars. Water regimes for this habitat range from irregularly exposed (E2USM), regularly flooded (E2USP) to irregularly flooded (E2USP).
Emergent areas closest to estuarine waters consist of regularly flooded (E2EM1N) salt-tolerant grasses (low salt and brackish marshes). These communities are mainly composed of Saprtina alterniflora, Distichlis spicata, Salicornia spp., Batis maritima, Juncas roemerianus, and Scripus maritimus in more saline areas. In brackish areas such as in the Trinitiy River delta at the head of Trinity Bay, species composition changes toward a brackish to fresh-water assemblage. At slightly higher elevations the irregularity flooded estuarine emergent wetlands (E2EM1P) (high salt and brackish marshes) include Spartina patens, Distichlis spicata, Spartina spartinae, Scripus maritimus, Borrichia frutescens, Astrer spp., and many others.
Table 5. Generalized characteristics of active coastal processes and conditions in the Galveston Bay area.
| Climatic zone: | Humid (Thornthwaite, 1948) |
| Average annual precipitation: | 41.8 to51.5 inches/yr (106.2 to 130.8 cm/yr) (Fisher and others, 1972) |
| Dominant wind direction: | Southeasterly, northerly (Fisher and other, 1972) |
| Average wind speed (in 1978 at Texas City): | 6.8 knots (12.6 km/hr) (Shew and others, 1981) |
| Astronomical tidal range: Gulf shoreline (Galveston Pleasure Pier) Mean diurnal: Bay shoreline (mean): |
2.1 ft (0.6m) (U.S Department of Commerce, 1959). 0.5 to 1.4 ft (0.2 to 0.4 m) (Diener, 1975) |
| Tidal current velocities: Bolivar Roads Average Maximum flood: Average Maximum ebb: |
3.3 knots (1.7 m/sec) (Bernard and others, 1959) 4.3 knots (2.2 m/sec) (Bernard and others, 1959) |
| Wave height (Gulf): (Caplan, Texas) Onshore wave height: |
Between 2.5 and 3.5 ft (0.8 and 1.1 m) about 65% of the time, (U.S. Army Corps of Engineers, 1956) |
| Direction of net longshore sediment transport: | Southwesterly (Fisher and Others, 1972) |
| Maximum hurricane surge height on open coast: | 12.7 ft (3.9 m) above MSL (Bodine, 1969) |
| Hurricane frequency: | 12% in any one year (Simpson and Lawrence, 1971) |
| Gulf shoreline change, Bolivar Roads to San Luis Pass from 1850-52 to 1973-74 |
Total gain from accretion of 1,074 acres and loss from erosion of 1,183 acres; net loss of 109 acres (Morton, 1977) |
| Subsidence: Pasadena - Houston Ship Channel area: |
8.5 to 9 ft (2.6 to 2.7 m) during 1906-1973 (Ratzlaff, 1980) |
| Faulting: Houston metropolitan area: |
Offset by at least 160 faults (Verbeek and Clanton, 1981) |
Figure 6. Natural systems in the Galveston Bay area.
Estuarine scrub-shrub wetlands (E2SS) are much less extensive than estuarine emergent wetlands. Representative plant species, which generally occur in irregularly flooded zones (E2SS1P) between emergent wetland communities and upland habitats, include Iva frutescens, Baccharis halimifolia, Sesbania drummondii, and Tamarix gallica.
Classes were mixed in complex areas where individual classes could not be separated. The most commonly used combinations include the estuarine emergent class (E2EM) and unconsolidated shore (E2US), for example, E2EM1P/USP. The estuarine emergent and unconsolidated shore combination was most frequently used on Galveston and Follets Islands where intertidal sand flats were juxtaposed with patches of salt-marsh vegetation. Vegetation commonly found in these areas include Monanthochole littoralis, Salicornia spp., Batis maritime, and Suaeda linearis.
The estuarine system extends upstream or landward to the point where ocean-derived salts are less than 0.5 parts per thousand (during average annual flow). Vegetation types, proximity and connection to estuarine water bodies, salinities of water bodies, and location of artificial levees and dikes are frequently used as evidence to determine the boundary between estuarine and adjacent fresh-water systems.
Palustrine areas include the following classes: unconsolidated bottom (open water), unconsolidated shore (including flats), emergent (fresh or inland marsh), scrub-shrub, and forested. Naturally occurring ponds are identified as unconsolidated bottom permanently or semipermanently flooded (PUBH or PUBF). Excavated or impounded ponds and borrow pits are labeled with their respective modifiers (PUBHx or BUBHh).
Palustrine emergent wetlands are generally equivalent to fresh, or inland marshes. Semipermanently flooded emergent wetlands (PEM1F) are low fresh marshes; seasonally flooded (PEM1C) and temporarily flooded (PEM1A) palustrine emergent wetlands are high fresh marshes. Emergent areas bordering estuarine vegetation and estuarine-influenced rivers are typically affected by tides. For these tidally influenced fresh-water, special water-regime modifiers are applied for semipermanently (PEM1T), seasonally (PEM1R), and temporarily (PEM1S) flooded areas.
Vegetation communities typically charactering Galveston Bay area are low emergent wetlands (PEM1F and PEM1T) include Scripus californicus, Typha spp., Alternanthea philoxeroides, Cyperus articulatus, Spartina patens (in higher areas), Scripus americanus, Polygonum hydropiperoides, Bacopa monnieri, Phragmites australis, Eleocharis spp., Zizaniopsis miliacea, and others. Areas topographically higher and less frequently flooded emergent wetlands (PEM1C and PEM1A) include Cyperus spp., Scripus americanus, Eleocharis spp., Sesbania drummondii (more typical in areas mapped as scrub-shrub), Typha spp., Spartina patens, and Polygonum hydropiperoides, to mention a few.
Palustrine scrub-shrub wetlands for the Galveston Bay area are typically flooded (PSS1C) and dominated by Salix nigra, Sapium sebiferum, and Sesbania drummondii. Temporarily and semipermanently flooded scrub-shrub habitat also occur with similar species. Water regimes include both tidally and nontidally influenced areas. Tamarix gallica is labeled PSS2A or PSS2C depending on the water conditions present.
Palustrine forested areas, semipermanently flooded (PFO2F), are represented by Taxodium distichum. Temporality (PFO1A) and seasonably (PFO1C) flooded forested areas incorporate a large mixture of tree species including Fraxinus pennsylvanica, Celtis laevigata, Salix nigra, Liquidambar styracflua, Gleditisa aquatica, Planera aquatica, Sapium sebiferum, Cephalanthus occidentalis, Acer rubrum, Betula nigera, and others. A split subclass was used when both needle-leaved and broad-leaved deciduous species are present (PFO2/1 or PFO1/2), with more than 30 percent coverage of each. The first subclass modifier is more abundant in canopy.
The most extensive net loss of emergent wetlands occurred in the Virginia Point quad located in the inland margin of West Bay, where more than 5,000 acres of emergent wetlands disappeared by 1989. The gross loss in emergent wetlands exceeded 8,000 acres, but this amount was offset by increases of about 3,000 acres in other areas of the quad. About 3,600 acres of emergent wetland habitat was converted to open water (E1UBL) and tidal flats (E2US). Most of the remainder of the decline was due to a change from emergent wetlands to uplands.
Probable Cause of Wetland Change in Virginia Point Area Subsidence and Sea-Level RiseRelative sea-level rise as used here refers to a rise in sea level with respect to the surface of the land, whether it is caused by actual sea-level rise or land-surface subsidence; the current general trend along the Texas coast, and in the Galveston Bay area, involves both of these processes
It is generally accepted that over the past century sea level has been rising on a worldwide eustatic basis at a rate of about 1 to 1.5 mm/yr, with a rate in the Gulf of Mexico and Caribbean region approximating 2.4 mm/yr. Adding "natural" compactional subsidence to these rates yields a relative sea-level rise that locally exceeds 10 mm/yr.
Rates of natural subsidence are dwarfed by rates associated with man-induced subsidence, which is a major factor in the relative sea-level rise equation in the Galveston Bay area. The major cause of man-induced subsidence is the withdrawal of underground fluids, principally water. Production of oil and gas can also cause subsidence. Extreme local subsidence has occurred in relation to sulfur mining around salt domes along the Texas Coast.Subsidence due to withdrawal of ground water from an artesian aquifer results from a decrease of hydraulic pressure and attendant movement of water from clays to adjacent sands leasing to compaction of the clays. Most of the compaction is permanent because of the inelastic nature of the clay; thus even, with total recovery of artesian pressure, less than 10 percent rebound can be expected.
Subsidence in the Houston-Galveston Area In the Houston-Galveston area, up to 3 m (10 ft) of man-induced subsidence has occurred between 1906 and 1987. Subsidence of more than 30 cm (1 ft) encompasses an area of approximately 2,330,000 acres. The subsidence "bowl" stretches from north to the Highlands quad to the south where it merges with a smaller bowl with as much as 1.8 m (6 ft) of subsidence centered on Texas City (figure 2.7). Another smaller subsidence bowl centered on Freeport extends into the Oyster Creek and Christmas Point quads at the south end of the study area.Rates of subsidence have varied both spatially and temporality. Average maximum rates of subsidence at the center of the "bowl" have been as high as 122 mm/yr (0.4 ft/yr) for the period 1964-1973. The rate of subsidence in the eastern part of the region (Pasadena area) decreased from about 90 mm/yr (0.3 ft/yr) from 1973 to 1978 to approximately 9 mm/yr (0.03 ft/yr) from 1978 to 1987. However, subsidence in the western part of the region increased a maximum rate of about 61 mm/yr (0.20 ft/yr) during 1973 to 1978 to about 67 mm/yr (0.22 ft/yr) during 1978 to 1987. The decline in subsidence rates in the eastern part of the region was due to curtailment of ground-water pumpage and the subsequent rise in aquifer water levels, whereas the acceleration in subsidence in the ground-water pumpage increased to the west.
Subsidence-Related Losses in Emergent WetlandsTransformation of emergent wetlands, or marshes, to areas of water and flats has occurred to some degree throughout the area. Total loss across all quads has exceeded 26,000 acres, accounting for about 30 percent of the total loss (gross loss excluding gains was about 88,500 acres) in the Galveston Bay system. Not all this loss can be attributed to subsidence, but throughout the region a whole, subsidence has been dominant as the major contributing factor to the replacement of emergent wetlands by open water and flats.
In Virginia Point, more than 3,600 acres of marshland was replaced by open water and mud flats between the 1950's and 1989. Significant subsidence has been documented in the area. Loss of marshland has been most extensive northwest and west of Jones Bay, where salt marshes have been converted to estuarine unconsolidated shore (E2US, intertidal flat) and estuarine unconsolidated bottom (E2SB, open water) (figure 2.8).
Additional losses occurred along the margins of Swan Lake (figure 2.8). Open water and flats also encroached into marshes in the adjacent Hitchcock quad. Approximately land-surface subsidence in the Virginia Point quad from 1906 to 1987 ranged from slightly less than 0.6 to 1.8 m (<2 to 6 ft). Estimated rates of subsidence in the area northwest of Jones Bay for the period of 1943 to 1987, exceed 14 mm/yr (0.05 ft/yr). This rate apparently was higher than rates of marsh aggradation in this area. On Galveston Island
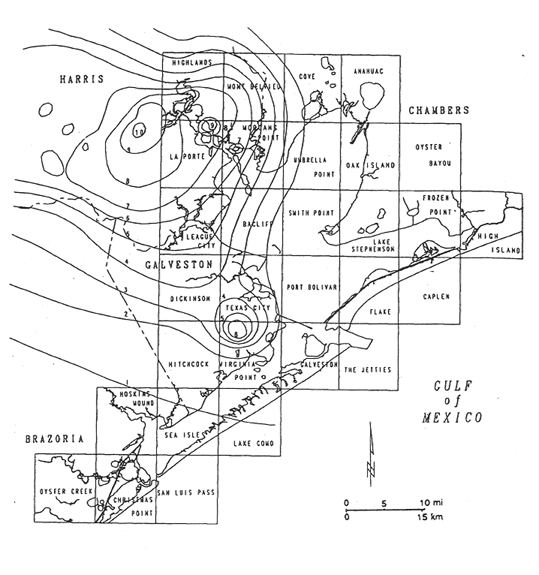
Figure 7: Land surface subsidence
in the Galveston Bay area, 1906 to 1987.
(contour interval = 1 ft)
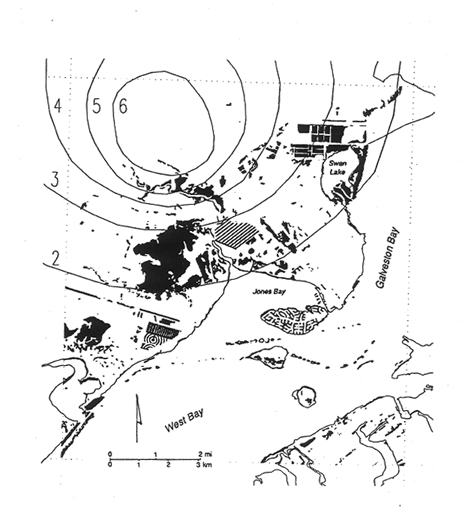
Figure 8: Relationship between subsidence and losses in emergent wetlands (shaded) by conversion to water and barren flats in the Virginia Point quad. Contours (in feet) show amount of subsidence that occurred between 1906 and 1987.
across West Bay from Virginia Point, there is also evidence that subsidence rates locally exceed marsh aggradation rates.
The League City quad offers another example of the effects of land-surface subsidence and the subsequent intrusion of open water and shallow flats into vegetated wetlands. Losses in emergent wetlands along Armand Bayou exceeded 91 percent of the resources between the 1950's and 1979, so there was little additional change in this area between 1979 and 1989. The League City quad represents the trend occurring along the valleys of bayous and creeks located on the north and west sides of Galveston Bay. The trend is one of expansion of open water and flats at the expense of marshes and woodlands, as subsidence promotes the encroachment of estuarine water up the valleys. The development, locally, of marshes along the valleys in more inland and marginal areas represent only a small fraction of the total amount of marsh loss.
Many losses and changes in wetland habitats are caused by process or activities other than subsidence. Among human activities in the Galveston Bay system that have a direct effect on wetlands and can be quantified to some degree through photoanalysis are construction of levees and dams to impound water; excavation (dredging) for purposes such as navigation, flood control, and mineral (sand) extraction; drainage for conversion to other land uses such as agriculture; and filling for purposes of spoil disposal or residential-commercial-industrial development.
Indirect losses due to such activities as chemical discharges, hydrologic alterations, and sediment diversion cannot adequately be determined through photoanalysis and will only be mentioned as possible contributing agents in some changes.
Activities causing direct changes assessed through photoanalysis can be classified into two board categories: (1) activities that convert emergent wetlands into flats and open water such as constructing impoundments and dredging (excavating) and (2) activities that convert wetlands into uplands such as draining, altering hydrology, and filling.
Virginia Point, in terms of total area and second to the Cove quad, was affected by impoundments and excavations. Nine-hundred acres of emergent wetlands (PEM, E2EM, and E2EM/FL) existing in the 1950's were replaced by water and faults at impounded and excavated sites (figure 2.9). Total wetland losses caused by channel dredging was larger than this because of associated filling of adjacent wetlands to produce upland sites foe urban development.
Conversion of Wetlands to Uplands
Emergent wetlands in the 1950's were identified as upland in 1989. The magnitude of this change is approximately 35,800 acres from the 1950's to 1989. The wetland system and class most heavily impacted by this type of change is the palustrine emergent wetland class
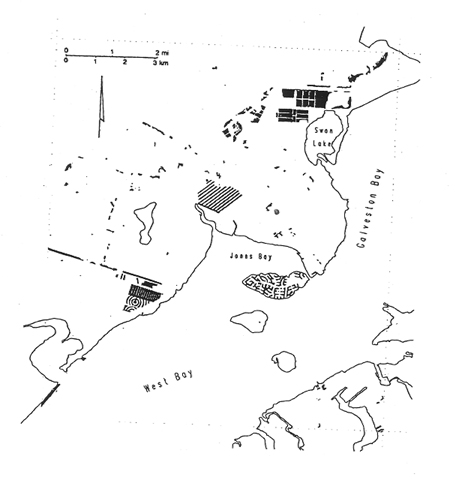
Figure 9: Distribution of emergent wetland habitats (shaded) in the 1950's that became excavated or impounded areas of open water and barren flats by 1989 in the Virginia Point quad. Excavated channels for existing or proposed residential developments surround Jones bay, and industrial impoundments characterize the area northwest of Swan Lake in the Texas City area.
(fresh-water or inland marshes). Among methods that are used to convert wetlands to upland is construction of drainage ditches to drop water levels and dry out the wetlands for grazing and rice farming. This was a common practice in the Galveston Bay area as well as in other parts of the United States, especially between the 1950's and 1970's. Restrictions placed on the alteration and destruction of wetlands since the 1970's has probably been one factor causing a decline in the rate of loss during 1979 to 1989.
Approximately 5,700 acres of emergent wetlands were converted to upland urban use from the 1950's to 1989. Losses were highest in the Virginia Point quad where they exceeded 1,000 acres. Conversion of wetlands to uplands occurred in several areas in conjunction with dredging and filling operations to create navigation channels and upland sites for residential development around Jones Bay and industrial development near Swan Lake. Losses due to dredging of channel and filling of wetlands for upland urban development in the Virginia Point quad totaled approximately 2,000 acres.
Between the 1950's and 1989, more than 1,500 acres of emergent wetlands were displaced by upland spoil ridges and mounds. The largest impact was in estuarine emergent wetlands, which are located along the margins of the estuarine water bodies where dredged channels are concentrated. The Intracoastal Waterway crosses both quads, and much of the impact occurred from spoil disposal along the dredged channel. Other areas where losses exceeded 100 acres include Sea isle, Virginia Point, Flake, and Frozen Point.
Some of the losses due to spoil disposal in emergent wetlands were offset by gains in wetlands on spoil islands and other disposal sites. Good examples of the spread of emergent wetlands on dredged materials are the Morgans Point and Bacliff quad in upper Galveston Bay, where spoil islands line the Houston Strip Channel. Islands in chain that extends from the west-central part of the Morgans Point quad into the northern part of Bacliff quad are sites where wetlands expanded, yielding a gross gain in estuarine emergent wetlands that exceeded 1,000 acres between the 1950's and 1989.
Although this gain in wetlands was trimmed by local losses on the islands, the gain provides a measure of areal of areal offset to losses in other quads due to spoil disposal. However, gains on spoil deposits provide only compensation for losses of wetlands in other areas because existing wetland habitats may have been impacted by the spoil, and because newly created wetlands are not functionally equivalent to oldest, natural wetlands. In addition, much of the gain in wetlands on spoil islands along the Houston Ship Channel are temporary because of expected burial of the wetlands during future channel maintenance dredging activities.
Trends and Status of Wetlands and Aquatic Habitatsin the Galveston Bay System, Texas
by
W.A. White, T.A. Tremblay, and E.G. Wermund, Jr.
Bureau of Economic Geology, The University of Texas at Austin
and
L.R. Handley
National Wetlands Research Center, U.S. Fish and Wildlife Service