Manatee River
Florida
A collaboration of several agencies, Tampa Bay National Estuary Program, Southwest Florida Water Management District, Florida Marine Research Institute, and the US Geological Survey Integrated Science Program: Tampa Bay Study, provided resources and funding for the compilation of information and production of materials for a WETMAAP site of Manatee River. Brief summary statements about the cooperative agencies helps explain their missions and interest in providing wetland education about Manatee River and Tampa Bay areas.
1. Tampa Bay National Estuary Program …………………….………………........….… 2.2
2. The Florida Marine Research Institute ………………………………………........…... 2.5
3. Southwest Florida Water Management District……………………………..........……. 2.6
4. USGS Gulf of Mexico Integrated Science Program: Tampa Bay Study ……...............… 2.7
5. Geographic Summary…………………………………………………..……….....….. 2.9
Introduction……………………………………………………………..….....….. 2.10
Figure 2.1: Tampa Bay Watershed Area ………………….………......…… 2.10
6. Estuaries …………………………………………………………………….…......... 2.11
7. Tampa Bay Estuary …………………………………………………………….......... 2.12
Facts about Tampa Bay………………….……..……………………....................2.12
8. Wetlands……………………………………………..……………………....……… 2.14
Introduction………………………………………………………………............ 2.14
Wetlands Characterization…………..…………………………..........…………... 2.14
Wetlands Monitored by the Southwest Florida Water Management District..........… 2.15
9. Native Habitats ……………….......……………………………………………....….. 2.17
10. Vegetation …………………………………………...………………..……....……. 2.17
Importance of Emergent Vegetation Habitats for Tampa Bay…….………........…... 2.17
Mangrove-Spartina Marsh……………………………………………….....…….. 2.18
Juncus Marshes ……………………………………………..………….....…….... 2.18
Salt Marshes…………………………………………………………….......……. 2.19
Mangroves………………………………………………………………..………. 2.19
Dominant Vegetation Habitats……………………………………………......……. 2.19
Table 2.1: Selected Dominant Vegetation for Tampa Bay……...................…. 2.20
11. Manatee River Watershed……………………………………..……………..………. 2.21
Manatee River Watershed Description………………………………..….....……… 2.21
Location………………………………..………………………………...........….. 2.21
Climate…..………………………………...……………………….............….….. 2.21
Physiography……….……………………………………..………..…….….……. 2.22
Hydrology…………………..………………………………………....…..……… 2.23
Land Use, Growth, and Development………………...………………......……….. 2.24
Table 2.2: 1995 General Land Use………………………….....…....……… 2.24
Table 2.3: 1995 Natural System..................................................................... 2.25
Table 2.4: 1995 Generalized Agriculture Land Use………….............……… 2.26
13. Sinkholes……………………………………………………………..…………..…. 2.26
General Types of Sinkholes………………...…………………………........……... 2.27
Collapse Sinkholes ……………………………………..…………..........……..… 2.27
Subsidence Sinkholes……………………………………..………….....………… 2.28
14. Issues………………………………………………………………..…...…………. 2.30
Water Quality……………………………. ……………………….….....……….. 2.30
Saltwater Intrusion………………………. ……………………….….….....…...... 2.30
Manatee Population……..………………. ……………………….….…….....….. 2.31
Figure 2.2: Manatee in Florida Waters………………………...…................. 2.31
Emergent Vegetation……………….………………………………….….....……. 2.32
Regional Development………. ……………………………………….……......…. 2.32
Table 2.5: 2010 Generalized Future Land Use ………………….………...... 2.23
15. References Consulted………………………………………..………………….…... 2.34
Tampa Bay was designated an "estuary of national significance" by Congress in 1990, paving the way for development of a long-term blueprint for bay restoration through the Tampa Bay National Estuary Program.
The Tampa Bay Program is a partnership of Pinellas, Hillsborough and Manatee counties, the cities of Tampa, St. Petersburg and Clearwater, the Florida Department of Environmental Protection, the Southwest Florida Water Management District and the U.S. Environmental Protection Agency. The Program is governed by a Policy Board composed of elected officials and a Management Board of top-level bay managers and administrators -- working with both technical and citizen’s advisory groups.
Since its inception, the Program has sponsored groundbreaking scientific research into the bay's most pressing problems and secured more than $1 million in grants to assist in the repair and restoration of the bay.
Charting the Course (Comprehensive Conservation and Management Plan)
Charting the Course, the Comprehensive Conservation and Management Plan for Tampa Bay, was approved in 1997. In 1998, the partners of the Tampa Bay National Estuary Program signed a landmark agreement pledging their commitment to implementing the Plan, and the program itself was reorganized as an independent regional alliance now known simply as the Tampa Bay Estuary Program, or TBEP.
Developing a plan to deal with the region's inevitable growth and associated pollution and stress on natural habitats is the primary mission of the Tampa Bay Estuary Program. Established in 1991 under the guidance of the U.S. Environmental Protection Agency, the TBEP has forged an unprecedented partnership of federal, state, regional and local interests.
In January [2003], the TBEP capped five years of research into the "state of the bay" with the release of its draft management plan, Charting The Course. This broad-based community action blueprint defines the most pressing problems facing the bay today, and presents cost-effective, realistic strategies to address today, and presents cost-effective, realistic strategies to address.
Success in achieving those goals will not be measured solely by water quality improvements, but also by an increase in the bay's living resources, such as seagrass - which serves as a life support system for so many of the bay's aquatic inhabitants.
Upon final approval of the bay master plan, TBEP participants will sign a formal agreement pledging to reach the bay restoration goals. Everyone - residents, businesses, agencies and local governments - is asked to participate in the bay's recovery, because all of us impact the bay in some way.
Just 30 years ago, Tampa Bay was so polluted many considered it beyond salvage. That it has come back to life is a testament to the resiliency of nature, and the continued dedication of hundreds of citizens, scientists and elected leaders who believe it is a resource worth saving.
Charting the Course details progress made in restoring and protecting Tampa Bay and advances strategies for continuing improvements well into the next century. Charting the Course divides the bay's most pressing problems into six action plans:
Water & Sediment Quality
Aided by laws requiring construction of better sewage treatment facilities, water quality in Tampa Bay is improving. However, excess nitrogen contributions and toxic contaminants continue to be key concerns. Goals for improving water and sediment quality include:
• Controlling the amount of nitrogen reaching the bay so that water clarity is sufficient to continue the gradual regrowth of as much as 14,000 acres of seagrass
• Reducing the amount of toxic pollutants in bay sediments and protecting relatively clean areas of the bay from being degraded by contaminants
• Gaining a better understanding of the role that air pollution plays in the bay's water quality, and identifying and addressing the sources of this pollution
• Reducing bacterial contamination now present in some portions of the bay to levels safe for swimming and shellfish harvesting
Bay Habitats
Water quality improvements are aiding the return of seagrasses to the bay, but other habitats - particularly tidal streams and marshes critical to fish and wildlife -will require a concerted, long-term restoration effort. Goals for improving bay habitats include:
• "Restoring the balance" of habitat types in the bay to 1950 ratios by creating roughly 100 acres of low-salinity tidal marsh every five years, while protecting existing mangroves and salt marshes
• Preserving adequate freshwater flows to Tampa Bay and its tributaries
• Reducing propeller scarring of seagrasses
• Implementing the TBEP master plan for habitat restoration that identifies priority restoration areas and presents various financing and land acquisition options
• Protecting often-overlooked habitats such as sponge and coral communities, oyster reefs and mud flats
Fish and Wildlife
Charting The Course seeks to increase the number, diversity and health of the bay's fish and wildlife populations by improving the areas in which they live, feed and reproduce. Restoring water quality and habitats will be critical to this effort. Additional goals to bolster fish and wildlife in the bay include:
• Improving on-the-water enforcement of fishing and environmental regulations
• Investigating opportunities to establish local manatee protection zones
• Restoring the bay scallop to lower portions of the bay
Dredging and Dredged Material Management
Maintenance of the bay's network of navigation channels is important to both commercial maritime industries and recreational interests. But a more coordinated approach to dredging is needed to protect the bay from the potentially damaging effects of such activities and address long-term disposal needs. The primary goal for dredging and dredged material management is:
• Developing a long-range dredging plan for the bay that will minimize environmental impacts and maximize beneficial uses of the dredged material
Spill Prevention and Response
The oil spill that occurred in Tampa Bay in August 1993 spotlights the need for preventive measures to avoid future spills of oil or hazardous materials. Additional actions also are needed to ensure rapid cleanup of any spills that do occur. Goals for spill prevention and response include:
• Installing a state-of-the-art vessel traffic system to improve coordination of ship movements along the bay's narrow shipping channel
• Installing permanent anchors for oil-containment booms near the bay's most environmentally sensitive areas
Public Education and Evolvement
There are many ways you can help to save Tampa Bay. The first step is to educate yourself by ordering some of our free publications. You can help even further by passing them along to a friend. Second, ask your child's teacher to include Tampa Bay conservation and preservation in the classroom. Finally, to find out how to get more involved in cleanup efforts and other volunteer activities, please fill out our I Want To Help! online form (www.tbep.org).
Florida Marine Research Institute (FMRI)
MISSION STATEMENT
Through effective research and technical knowledge, we provide timely
information and guidance to protect, conserve, and manage Florida's marine and
coastal resources.
Strategic Plan
The Florida Marine Research Institute (FMRI) is a division of the state's Fish
and Wildlife Conservation Commission (FWC). FMRI conducts applied research and
provides synthesized information that addresses marine resource management
issues. The 2002 FMRI Strategic Plan represents the combined efforts of our
dedicated staff and the contributions of hundreds of resource managers,
customers of our research, and public and private stakeholders. Together, we
have created a framework for guiding FMRI's ongoing research and planning
efforts. In the process of creating this plan, we initiated a statewide dialogue
on the strategies necessary to create sustainable marine and estuarine
environments. We strive to provide the best support possible for policy and
management decision-making by the FWC and its Commissioners. Considering the
diversity of Florida's marine resources and the magnitude of challenges that we
face, this is a formidable task.
FMRI Organization
The Florida Marine Research Institute (FMRI) is a division of the Florida Fish
and Wildlife Conservation Commission. FMRI provides the state's technical focal
point for conducting applied marine research and ensuring that the scientific
needs of our resource managers are met. There are over 130 research projects
covering over 150 key marine resources-commercial and recreational fisheries,
endangered and threatened species, marine and estuarine habitats, and harmful
algal blooms such as red tide. These projects are organized within broad,
interrelated program areas of Fisheries Assessment, Ecosystem Assessment and
Restoration, Endangered & Threatened Species, and Information Science &
Management. Detailed information about each program project can be found in the
FMRI science program document listed below.
Recognizing and needing the effective marine resource expertise and work of others and to avoid duplication, we collaborate with and direct funding to many academic, non-profit, and private marine research institutions. Links to these organizations can be found on this Web site: http://www.floridamarine.org/partners.
FMRI Budget
Florida Marine Research Institute's (FMRI) annual operating budget is
approximately $32,577,152. The major sources of funding include saltwater
fishing license revenue, state general revenue, and federal grants. We also
collaborate with other state, regional, and local governments to develop
mutually beneficial technical information used in the local management of
natural resources.
FMRI Science Programs
At FMRI, scientific research and information synthesis are accomplished through
the cooperative efforts of four core groups: Fisheries Assessment, Ecosystem
Assessment and Restoration, Endangered & Threatened Species, and Information
Science & Management.
Southwest Florida Water Management District
MISSION STATEMENT
The mission of the Southwest Florida Water Management District (The District) is
to manage the water and water-related resources within its boundaries. Central
to the mission is maintaining the balance between the water needs of current and
future users while protecting and maintaining the natural systems that provide
the District with its existing and future water supply.
The Governing Board of the Southwest Florida Water Management District assumes its responsibilities as authorized in Chapter 373 and other chapters of the Florida Statutes by directing a wide-range of programs, initiatives, and actions. These programs include, but are not limited to, flood control, regulatory programs, water conservation, education, and supportive data collection and analysis efforts.
District Overview
The Southwest Florida Water Management District is one of five regional agencies
in Florida directed by state law to preserve and protect water resource within
its region. The District includes approximately 10,000 square miles in all or
part of 16 counties in west central Florida. It extends north to Levy County,
south to Charlotte County, and inland to Polk and Highlands counties. The
District also encompasses the Green Swamp, headwaters for the Peace,
Hillsborough, Withlacoochee, Kissimmee and Ocklawaha rivers, and numerous lakes,
springs and streams. Created by the Florida Legislature in1961 to resolve
flooding problems, the District's responsibilities expanded dramatically with
the passage of the Water Resources Act in 1972. Today its duties involve water
use and water quality regulation, long-range planning, land acquisition, aquatic
weed control, flood control, water conservation, water resources education,
water shortage planning, and restoration of certain lakes, rivers and bays. An
11-member Governing Board oversees District activities. Each member is appointed
by the Governor to a four-year term, subject to confirmation by the Florida
Senate. Board members must reside in specific watershed basins within the
District, except for three who are appointed at large.
WATER SUPPLY
To ensure an adequate supply of the water resource for all reasonable and
beneficial uses, now and in the future, while protecting and maintaining the
water and water-related resources of the District.
FLOOD PROTECTION
To minimize the potential for damage from floods by protecting and restoring the
natural water storage and conveyance functions of floodprone areas. The District
shall give preference whenever possible to non-structural surface water
management methods.
WATER QUALITY MANAGEMENT
To protect water quality by preventing further degradation of the water resource
and enhancing water quality where appropriate.
NATURAL SYSTEM MANAGEMENT
To preserve, protect and restore natural systems to support their natural
hydrologic and ecologic functions.
MANAGEMENT SUPPORT
To ensure management support services effectively and efficiently contribute to
realization of the District's mission to manage and protect water resources.
Tampa Bay Integrated Science Pilot Study
The U.S. Geological Survey (USGS) Tampa Bay Pilot Study responds to the need to use an integrated science approach for studying the interrelations between geological, biological, chemical, and hydrological components of estuarine systems, and the impact of natural and anthropogenic change to all components of estuarine systems. The USGS Geological (GD), Biological Resources (BRD), Water Resources (WRD), and National Mapping (NMD). Disciplines are working together with other federal, state, and local partners to develop and implement an integrated, multidisciplinary science strategy for estuarine research. Results from this research will enable scientists and resource managers to better assess the fate of our estuaries in the future. The integrated science strategy developed through this project will be used as a model for USGS integrated science in other Gulf of Mexico Estuaries.
The Tampa Bay Pilot Study addresses some of the most pressing societal and ecological problems of the Tampa Bay Estuary. As a pilot study, the project will serve to develop a template for application of integrated research projects in other estuaries in the Gulf of Mexico. The USGS has designed the Tampa Bay Pilot Study with the following four major components to focus on the identified scientific needs of the bay:
• establish baseline maps and bathymetry
• identify sources and quality of groundwater seeping into the bay
• establish current, historical, and pre-historical wetland conditions to document trends in ecosystem health and status
• provide a web-based clearinghouse of information for scientists and the public, including a prototype Tampa Bay Decision Support and Query System for decision-makers.
The Tampa Bay Pilot Study will:
1. Define the current status and health of Tampa Bay.
2. Enable predictions on the effects of anthropogenic modifications and the future outlook of Bay health.
3. Provide baseline earth science information that will link process and characterization studies that will be undertaken by our partners.
4. Contribute to the National Estuaries Assessment.
5. Provide the strategic foundation for integrated research in other Gulf of Mexico estuaries.
The need for this information has been identified by potential partners (including USF and FWC-FMRI), and is critical for making informed decisions regarding land and water-use regulations.
Digital Library
In an effort to provide more digital maps, publications, and miscellaneous documents, NWRC (USGS National Wetlands Research Center) is introducing the Tampa Bay Estuary Digital Library.
The Digital Library includes current and historical data related to the Gulf of Mexico Integrated Science Program. Information acquired in this study must be accessible by managers, city planners, as well as State and Federal legislators.
The Digital Library serves as a clearinghouse for scientific data; maps, metadata, documents and GIS data which characterize the ecology of the Tampa Bay Estuary.
Summary information on Manatee River is a compilation of direct excerpts from the websites of Florida Marine Research Institute, Tampa Bay National Estuary Program, and Southwest Florida Water Management District. More detailed information about each funding agency and their programs are available on their websites (listed under Resources Consulted). Additional statements that further clarify issues are from multiple sources including Open File documents, government documents, Internet accessible data and are listed under Resources Consulted found at the end of the geographic summary. Information on counties of the Tampa Bay watershed areas is from Internet sources and U.S. Census data. Information on the Manatee River watershed is from Internet sources, U.S. Census data, and Manatee River Comprehensive Watershed Management Plan. Only direct quotes or facts are cited. General information from multiple sources and data from Internet websites are not specifically cited.
Note: The Geographic Summary is a compilation of information from existing sources and is intended to provide a brief synopsis concentrating on wetland changes of the Tampa Bay and Manatee River Watersheds. It is not meant to be an in-depth treatise on the geography and background of the area.
Tampa Bay, one of the Gulf of Mexico’s
largest estuaries, exemplifies the environmental stresses that our nation’s bays
and estuaries face in general. More than 2 million people live in the Tampa Bay
watershed (figure 2.1), and the population continues to grow. Increased
development demands more fresh water, and creates greater air and water
pollution. Despite the changing quality and quantity of water entering the bay
and dramatic alteration of sensitive coastal environments, the scientific
baseline controls documenting these changes have not yet been established.
Figure 2.1: The Tampa Bay watershed is 2,220 square-miles. Tampa Bay is Florida’s largest open water estuary covering almost 400 square miles.
Tampa Bay, Sarasota Bay, and Charlotte Harbor are the largest estuaries in the Southwest Florida Wter Management District. Like other estuaries, there are transitional zones between fresh and salt water and are especially valuable because of their role in marine fisheries production. Estuaries often serve as a hatchery for juvenile fish which move into deeper water as they mature. If the quality or quantity of estuaries is degraded, the ability of certain species to reproduce can be seriously damaged.
The cycle of fresh water flowing into estuaries is a primary concern in managing their health. The timing and volume of fresh water coming into estuaries are probably the most important factor controlling the physical, chemical and biological characteristics of these water bodies. Among other things, the fresh water establishes circulation patterns, regulates salinity levels and delivers nutrients and sediments to the estuaries and their dependent species. Many species that depend on estuaries use them primarily during immature larval or juvenile stages. These early life stages require the lower salinity created by the fresh water mixing with salty seawater. The immature creatures are thus able to take advantage of the rich food sources found in low and moderately salty water. Therefore, a direct ecological link exists between fresh water flowing into an estuary and fishery production.
Fresh water that flows into an estuary often originates many miles away. For that reason, managing the water quality in an estuary involves management of the entire watershed that drains into it. There are 11 watershed management areas comprising the District. Ten of them ultimately drain into the Gulf of Mexico or an estuary feeding the Gulf. Approximately 2,200 square miles, or 24 percent of lands in the District, drain into
Tampa Bay. Therefore, integrated watershed management is an important initiative for priority estuaries in the District. Integrated management is implemented through the planning and programs of the National Estuary Program (NEP) and the Surface Water Improvement and Management (SWIM) program. The NEP was established in 1987 through the Federal Water Quality Act, which authorizes the Environmental Protection Agency to develop management plans for estuaries of national significance that are threatened by pollution, development or overuse. Tampa Bay, Sarasota Bay and Charlotte
Harbors were included in the National Estuary Program, as was the coastal area between the Weekiwachee and Withlacoochee rivers. Tampa Bay now has its own estuary program.
Tampa Bay, Florida's largest open-water estuary stretches 398 square miles at high tide. Popular for sport and recreation, the bay also supports one of the world's most productive natural systems. Estuaries like Tampa Bay, where salt water from the sea and fresh water from rivers and uplands mix, are nurseries for young fish, shrimp, and crabs. More than 70 percent of all fish, shellfish, and crustaceans spend some critical stage of their development in these nearshore waters, protected from larger predators that swim the open sea.
Wildlife abounds along the shores of Tampa Bay. As many as 40,000 pairs of birds--from the familiar brown pelican to the colorful roseate spoonbill--nest in Tampa Bay every year. Others, including sandpipers and white pelicans, are seasonal visitors. The bay is also home to dolphins, sea turtles, and manatees.
1. Tampa Bay is the largest open-water estuary in Florida, encompassing nearly 400 square miles and bordering three counties -- Hillsborough, Manatee and Pinellas. The bay's sprawling watershed covers a land area nearly five times as large, at 2,200 square miles.
2. More than 100 tributaries flow into Tampa Bay, including dozens of meandering, brackish-water creeks and four major rivers -- the Hillsborough, Alafia, Manatee and Little Manatee.
3. A single quart of bay water may contain as many as 1 million phytoplankton -- microscopic, single-celled plants that are an essential thread in the "who eats who" marine food web.
4. More than 200 species of fish are found in Tampa Bay, including the popular snook, redfish and spotted sea trout.
5. Mangrove-blanketed islands in Tampa Bay support the most diverse colonial waterbird nesting colonies in North America, annually hosting 40,000 pairs of 25 different species of birds, from the familiar white ibis and great blue heron to the regal reddish egret -- the rarest heron in the nation.
6. Each square meter of bay sediment contains an average of 10,000 animals -- mostly tiny, burrowing worms, crustaceans and other mud-dwellers that are known as benthic invertebrates. The most numerous creature in the bay sediment is a primitive, fish-like invertebrate about two inches long called branchiostoma.
7. On average, Tampa Bay is only 12 feet deep. Because it is so shallow, manmade shipping channels have been dredged to allow large ships safe passage to the Port of Tampa and other bay harbors. The largest of these, the main shipping channel, is 43 feet deep and 40 miles long.
8. The Port of Tampa is Florida's largest port and consistently ranks among the top 10 ports nationwide in trade activity. It contributes billions annually to the region's economy.
9. More than 4 billion gallons of oil, fertilizer components and other hazardous materials pass through Tampa Bay each year.
Introduction
Coastal wetlands in Tampa Bay consist of mangrove forest and tidal salt marsh. Wetlands buffer storm surges, provide fish and wildlife habitat, and enhance water quality through the removal of water-borne nutrients and contaminants. Substantial areas of both mangrove and salt marsh have been lost to agricultural, residential and industrial development in this urban estuary.
Wetlands restoration has been initiated in Tampa Bay. Baseline studies on the current condition of wetlands and historical and prehistorical information is needed for successful restoration planning and evaluation.
A major objective of this component of the Tampa Bay pilot program is to characterize wetlands in Tampa Bay beginning with areas that differ in their degree of human-induced disturbance.
The Alafia River area is urbanized, industrialized and dredged, whereas the Terra Ceia area has a history of agricultural use with associated soil berms and mosquito ditches, but has not been farmed for at least 20 years
Wetlands Characterization
Summary
• Reduction of freshwater inflow in the Alafia River is coincident with conversion of salt marsh to mangrove vegetation at locations in the lower portion of the river. Future studies will explore possible causative factors of this vegetation change.
• Tidal channels in both the Alafia River and at Terra Ceia provide year-round habitat for resident fishes as well as nursery habitat for transient fishes that are spawned offshore. In contrast, the many brackish ponds at Terra Ceia are dominated by resident fish species.
• Several identified faunal and floral species will effectively serve as ecological indicators of environmental conditions, both natural and anthropogenic.
• Monitoring sites will assist in linking wetland conditions to environmental parameters such as hydrodynamics, climate change, and water and sediment quality.
Wetlands Monitored by the Southwest Florida Water Management District
Wetlands comprise nearly one-fifth of the Southwest Florida Water District. What is a wetland, and what is not, can be a subject of great controversy because use of wetlands is regulated and limited by statute. Generally, the District defines wetlands as areas that are inundated or saturated by surface water or ground water to support, and under normal circumstances do support, vegetation typically adapted for wet soils.
The ecological and economic values of wetlands include:
1. Water quality protection:
Wetlands filter sediments, nutrients and other materials from surface run off into water bodies.
2. Floodwater storage, lessening the risks and degree of flooding:
Wetlands act as water storage and flood detention areas. They are natural reservoir systems.
3. Fish and wildlife habitat:
Wetlands serve as critical habitat for a variety of important game species, such as waterfowl, as well as many other species of wildlife. They also serve as nursery habitat for a variety of commercially and recreationally important fish species, and as a critical habitat for a number of wildlife species with protected status, such as gopher frogs, white Ibis, wood storks, sandhill cranes, gopher tortoises, long-tailed weasels and Eastern Indigo snakes, among others.
4. Shoreline storm buffering:
Coastal wetlands mitigate damage to inland areas from hurricanes and other large storms. Moreover, coastal marshes damaged by a hurricane repair themselves at no cost, whereas waterfront development usually must be repaired at great cost.
5. Underground water recharge:
Certain types of wetlands fulfill important underground water recharge functions. Because wetlands store or slow the movement of water, the water has more time to percolate into the ground and refill the surficial aquifer.
6. Aesthetic benefits:
Wetlands have a number of intrinsic, aesthetic values including scenery and passive recreational opportunities, like hiking and photography. Wetlands can be damaged by significant changes in either surface-water or ground-water systems that supply water to them. Inappropriate dredge and fill projects are one common way that adverse changes are made in the surface-water supply to wetlands. When this occurs, water that normally would flow to a wetland is routed elsewhere. Or the wetland itself is filled with soil, raising its elevation so that water no longer flows to it. Ground water supplies to wetlands can be reduced by excessive pumping from the aquifer under or near wetlands. When this occurs, the underground water level is lowered so much that ground water can no longer reach and seep into the wetland.
Protecting wetlands means taking into account all of their functions and benefits. Protection does not consist just of preventing wetlands destruction by development, or requiring mitigation by developers for wetlands that are lost. It also must include protection of those periods in the wetlands natural cycle when they should be wet in order to preserve their structure and function. It could also include providing water of suitable quality to wetlands during periods of drought.
Tampa Bay is a rich mosaic of fish and wildlife habitats that supplies life-sustaining links in an ecosystem as biologically productive as some of the world's most celebrated rain forests. From coastal mangroves and marshes to underwater meadows of seagrass, from the open bay to the salty mouth of the Gulf of Mexico, each interdependent habitat plays a vital role.
Bay habitats supply food and shelter for creatures as diverse as the great blue heron and the spiny sea urchin. Seagrasses and mangroves, the most prominent of the bay's "aquascapes", contribute significantly to a dynamic food chain that draws nutrients from the bay floor. As seagrass and mangrove leaves decay, they provide food for small creatures that are ultimately consumed by fish and larger predators.
Seagrasses are flowering underwater plants found at shallow depths in protected bays and lagoons and in patches along the continental shelf of the Gulf of Mexico. As a nursery environment, seagrasses support small fish, shrimp, and crabs that hide among the blades and feast on decaying leaves. Seagrasses also help stabilize shifting sands on the bottom of the bay and improve water clarity by trapping fine sediments and particles.
Once plentiful, seagrass beds now cover less than half of their original acreage in Tampa Bay--a loss triggered by dredge-and-fill activity and declines in water quality. Damage from motor boats is severe in areas. As boats carve through shallow grass flats, their propellers cut sandy trenches that may stay barren for years.
The following description on vegetation is from A Summary of Emergent Vegetation Habitat Coverage Data for Tampa Bay, August 2000, Tampa Bay Estuary Program Technical Report #08-00.
Importance of Emergent Vegetation Habitat in Tampa Bay
Emergent vegetation habitats are critical for recreationally and commercially important fish, shrimp, and shellfish, including pink shrimp, menhaden, blue crabs, mullet, red drum, tarpon, and snook (Haddad, 1998). These habitats are also important as feeding,
nesting, and roosting areas for many avian species, including pelicans, cormorants, herons, ibises, roseate spoonbills, and reddish egrets. Emergent vegetation habitats also serve to improve water quality by filtering runoff and stabilizing shorelines, and are important components of the energy and nutrient cycling in coastal environments.
There are three functional emergent vegetation habitat types in Tampa Bay:
Mangrove-Spartina Marsh
Juncus Marsh, and
Salt Barrens
Mangrove-Spartina Marsh
Mangrove-Spartina Marshes contain a mix
of mangrove species, including Rhizophora mangle L. (red mangrove), Avicennia
germinans L. (black mangrove), Laguncularia racemosa Gaertn. f. (white
mangrove), and Conocarpus erecta L. (buttonwood). This emergent vegetation
habitat type includes the fringe of Saprtina alterniflora (cordgrass) often
found in association with mangroves. Juncus Marshes are dominated by Juncus
roemerianus Scheele (black needlerush). Salt Barrens are normally found at
higher elevations than Mangrove-Spartina Marshes and Juncus Marshes, and contain
highly saline substrate.
Spartina alterniflora often acts as the pioneer species of newly available substrates. The cordgrass reduces wave energy and encourages settling of sediments. The accumulation of sediments allows the establishment of mangroves, which eventually dominate the substrate (Davis 1940; Lewis and Dunstan, 1976; Lewis 1982a, 1982b). Functionally, Mangrove-Spartina Marshes stabilize shorelines, provide fisheries habitat, and are a source of detritus for estuarine food chains.
Juncus Marshes
Juncus roemerianus is the major
emergent vegetation component in this salinity zone. Juncus Marshes are in the
transition zone between freshwater and high-salinity environments, and provide
input to estuarine food chains and function as nursery areas for estuarine
species (Haddad, 1989).
Salt Marshes
Salt marshes, which are composed of
salt-tolerant rushes, sedges, and grasses, occur along the shorelines of
estuaries like Tampa Bay in areas where wave action is minimal. These marshes,
which periodically become submerged, nourish and protect many fish and animals.
They also buffer upland areas from storms and help filter pollutants that run
off the land.
Mud flats around the bay's fringe are exposed at low tide. Although these flats are barren of visible vegetation, they are teeming with life. Small crabs, clams, and worms, which burrow in the mud, supply a veritable feast for birds wading at low tide.
Mangroves
Mangroves are tropical trees that
thrive in salty environments along the water's edge. Like seagrasses, they
provide food and cover for a vast array of small fish and animals. Their roots
anchor shorelines, and their branches serve as nesting sites for a wide variety
of birds. Nearly half of the mangrove swamps that once ringed Tampa Bay have
been replaced by development and seawalls.
Loss of this important habitat has contributed to a decline in fisheries throughout the bay. In order to protect mangroves, local and state regulations restrict pruning and removal.
Three species of mangroves are common in Tampa Bay. Red mangroves, typically located closest to the water, are easily distinguished by their tangled reddish roots that branch out over the water. Mounds of oysters frequently colonize at their base. Black mangroves feature numerous finger- like projections called pneumatophores, which surround the base of the tree. White mangroves, which often occupy the highest elevations of the three species, have no visible aerial root system. The leaves of the white mangrove are yellow-green.
Dominant Vegetation Habitats
Tampa Bay has many vegetation habitats
including salt marsh, fresh marsh, wetland forest, wetland scrub-shrubs, upland
forested, and upland scrub-scrub. Table 2.1 lists selective dominant vegetation
by type, scientific name, and common name for the area.
| Classification | Scientific Name | Common Name |
| Salt Marsh | Baccaharis halimifolia | Saltbrush |
| Salt Marsh | Distichilis spicata | Saltgrass |
| Salt Marsh | Juncus roemerianus | Blackrush |
| Salt Marsh | Spartina alterniflora | Smooth cordgrass |
| Salt Marsh | Spartina patens | Slender cordgrass |
| Fresh Marsh | Cladium jamaicensis | Sawgrass |
| Fresh Marsh | Nuphar luteum | Spatterdock |
| Fresh Marsh | Phragmites communis | Reed |
| Fresh Marsh | Rhynchelytrum repens | Natal grass |
| Fresh Marsh | Typha domingensis | Cattail |
| Fresh Marsh | Typha latifolia | Cattail |
| Wetland Forested & Wetland Scrub-shrub |
Acer rubrum | Southern red maple |
| Wetland Forested & Wetland Scrub-shrub |
Avicennia germenans | Black mangrove |
| Wetland Forested & Wetland Scrub-shrub |
Fraximus coroliniana | Water ash |
| Wetland Forested & Wetland Scrub-shrub |
Rhizophora mangle | Red mangrove |
| Wetland Forested & Wetland Scrub-shrub |
Taxodium distichum | Bald cypress |
| Wetland Forested & Wetland Scrub-shrub |
Sabal palmetto | Cabbage palm |
| Wetland Forested & Wetland Scrub-shrub |
Conocorpus erecta | White buttonwood |
| Wetland Scrub-shrub | Laguncularia racemosa | White mangrove |
| Wetland Scrub-shrub | Ludwigia peruviana | Primrose willow |
| Wetland Scrub-shrub | Myrica cerifera | Wax murtle |
| Wetland Forested & Upland Forested |
Quercus sp. | Oak |
| Upland Forested & Upland Scrub-shrub |
Seronoa repens | Saw palmetto |
| Upland Forested | Casuarina equisetifolia | Australian pine |
| Upland Forested | Pinus clausa | Sand pine |
| Upland Forested | Pinus elliotii | Slash pine |
| Upland Scrub-shrub | Juniperus silicicola | Red ceder |
Table 2.1:
Selected dominant vegetation for Tampa Bay
(Source: Technical Publication #04-92, May 1992, Tampa Bay National Estuary
Program.)
The following information on the Manatee River Watershed is from the Manatee River Comprehensive Watershed Management Plan, April 26, 2001, prepared by: The Southwest Florida Water Management District on cooperation with Manatee County, City of Bradenton, and City of Palmetto.
Executive Summary of the Manatee River Comprehensive Watershed Management Plan
The Manatee River watershed extends over most of the northern and western parts of Manatee County with small portions extending into northern Sarasota County and southeastern Hillsborough County. The watershed is highly developed in the western region, particularly the Cities of Bradenton and Palmetto. The watershed is comprised of two major river systems, the Manatee and Braden Rivers both of which have been impounded to develop the Lake Manatee and Bill Evers Reservoir which are used for potable supply purposes. Extensive agriculture areas within the watershed are rapidly being converted in to residential areas, particularly in the Braden River watershed. Strong population growth in this watershed continues to create numerous issues regarding land and water use.
Manatee River Watershed Description
Location
The Manatee River Watershed is located almost entirely in Manatee County in the urbanizing Tampa Bay region of west-central Florida. The County covers approximately 742 square miles in land area and some 151 square miles of water. The Manatee Rivers begins at an elevation of about 130 feet in marsh on the northeastern part of the County near Four Corners and flows approximately 45 miles in a westerly direction to southern Tampa Bay and the Gulf of Mexico. The river drains an area of about 360 square miles consisting mainly of Gulf Coastal Lowlands, hardwood swamps, marsh, and mesic flatwoods.
Manatee County has a humid, sub-tropical climate characterized by high mean annual rainfall and temperature. Summers are warm and humid and winters are mild as a result of low altitudes and the moderating effects of Tampa Bay and the Gulf of Mexico.
The means annual air temperature is about 72° F and the mean monthly temperatures range from 60° F in winter to 80° F in summer. Rainfall amounts average about 54 to 55 inches per year with both seasonal and annual variation.
The Manatee River Watershed lies within three physiographic provinces: the Polk Upland, the DeSoto Plain and the Gulf Coastal Lowlands from east to west (White, 1970). The Manatee River begins in the eastern part of the County in the Polk Uplands and flows down through the DeSoto Plain to the Gulf Coastal Lowlands in the west. The coastal lowlands are composed of nearly level plains while the DeSoto Plains and Polk Uplands have a gently rolling topography (White, 1970). The Polk Uplands contain areas refered to as the “Bone Valley” formation which is the area where phosphate and rare earths occur, although most mining most activities in the region occur outside the watershed.
The Gulf Coastal Lowlands province lies along the west coast and varies up to about forty miles inland in some places. Within the Manatee River Watershed, it extends about 10-15 miles inland, nearly to Lake Manatee reservoir. The Gulf Coastal Lowlands are characterized by flat topography with elevations below 40 feet and sandy, shelly, and silty sand soils. The DeSoto Plain extends eastward for about 3 miles in the northern portion of the watershed to about 10 miles in the southern portion and consists of white sandy soils at elevations from about 40’ to 100’. The Polk Upland occurs in the northeast quadrant of the County, eastward of the Lake Manatee Reservoir at elevations form approximately 100’ to 140’ and contains Bone Valley Formation (SWFWMD, 1988a).
The soils found in Manatee County generally fall into four broad divisions:
1. very poorly drained;
2. poorly drained;
3. somewhat poorly drained to moderately well drained; and
4. poorly to moderately well drained.
The very poorly drained soils included most of the nearly level black sand in swamps, tidal marshes, and river floodplains. The natural vegetation consist mostly of mangrove but in some places it also consists of the seashore salt grass, batis, marsh hay, cordgrass, and oxeye daisy. The freshwater swamps and river floodplains that are flooded most of the year have native vegetation mostly of gum, oak, maple, hickory, bay, magnolia, cypress, wax myrtle, and some water tolerant grasses in the low areas. Low ridges support saw palmetto and scattered pine. Recharge is low in this division.
Poorly drained soils of the flatwoods make up the majority of Manatee County. These nearly level to gently sloping sandy soils has natural vegetation that consists of longleaf and slash pine and undergrowth of saw palmetto, gallberry, wax myrtle, huckleberry, threeawn, and scattered fetter bushes. Many areas are used as rangeland, pasture, and for vegetables. Recharge is moderate to low in this division.
The somewhat poorly to moderately well drained soils of the sand ridges and knolls are nearly level to gently sloping sandy soils. The majority of these soils occur in the higher elevations of northeast Manatee County and old dunes along the Gulf Coast. The native vegetation consists of oak, pine, saw palmetto, and perennial grasses. Infiltration is generally high in this division, but recharge is low.
The coastal highlands consist of poorly to moderately well drained soils. This shelly sand in low areas is barren with some weeds and bushes. The higher areas are vegetated by pine, oak, saw palmetto, gallberry, wax myrtle, huckleberry, pineland threeawn, and scattered bushes. Recharge is low to moderate in this division (SWFWMD, 1988b).
Manatee County lies within the southwest Central Florida Groundwater Basin and is underlain by a multi-layered freshwater aquifer system which includes the surficial, intermediate, and Floridian aquifer systems. Miocene to Recent age sands, phosphatic sands, silts, marls, limestones, and phosphorites of variable thickness overlie Cretaceous and Tertiary carbonate deposits.
The surficial aquifer occurs in the undifferentiated sands which overly the entire county and vary from less than 25 feet along the coastal areas to more than 50 feet in thickness in the northeastern part of the County. The intermediate aquifer is present throughout the County and varies in thickness form less than 200 feet to more than 350 feet (Scott, 1981). The Floridian system, which can be divided into he Upper and Lower Floridan
aquifers throughout the County, thickens from approximately 1,200 feet in the northern areas of the County to more than 1, 600 feet to the south. Generally, water quality in the Floridian Aquifer is good but tends to deteriorate due to increasing mineralization as one moves south into the Everglades region (SWFWMD, 1988a)
Land Use, Growth, and Development
In 1995, urban and built-up areas comprised about 32,280 acres, or nearly 14% of the watershed total area, agriculture comprised 92,979 acres (40.3%) of the watershed, rangeland some 32,942 (14.3%), upland forests some 25,696 acres (11.1%), and wetlands some 30,452 acres (13.2%) (Table 2.2). The vast majority of the urban and built-up lands occur in the westernmost portions of the watershed, in the cities of Bradenton, Palmetto, and adjacent unincorporated areas.
Table 2-2: 1995 General Land Uses and Land cover for the Manatee River Watershed
| Land Use – Land Cover | Total Acres | Total Percent |
| Urban and Built-up Agriculture Rangeland Rangeland Forests Water Wetlands Barren Land Transportation, Communication and Utilities |
32,259.90
92,979.48 32,941.76 25,696.13 12,773.06 30,452.22 119.35 3,384.89 |
14.0 40.3 14.3 11.1 5.5 13.2 0.05 1.5 |
| Total 230,606.79 | ||
Source: Manatee River Comprehensive Watershed Management Plan, p. 2-7
The Manatee River watershed reflects a wide variety of land used and conversions of natural lands, principally as a result of urban, suburban, commercial, industrial and agricultural development. Due to past over-development practices, much of the natural systems in the watershed have been impacted. About 38 percent of the watershed is considered “natural.” Of these natural areas, rangeland comprises about 14.3 percent of the watershed, pine flatwoods and other natural upland forests about 11.1 percent, and wetlands about 13.2 percent of the watershed (Table 2.3). Other natural areas and habitats comprise only a small part of the total watershed area.
Table 2-3: 1995 natural systems in the manatee River Watershed by the Florida Land Cover Classification System Code (FLUCCS)
| FLUCCS Codes – Land Cover | Total Acres | Percent of Watershed |
| 300 Rangeland 400 Upland Forests 410 Upland Coniferous Forest 411 Pine Flatwoods 420 Upland Hardwood Forest 600 Wetlands 610 Wetland Hardwood Forest 611 Bay Swamp 612 Mangrove Swamp 615 River/Lake Swamp 620 Wetland coniferous Forest 621 Cypress 630 Wetland Forested Mix 641 Freshwater Marsh 642 Saltwater Marsh 643 Wet Prairies 644 Aquatic Vegetation 651 Tidal Flats 653 Intermittent Ponds |
32,941.76
25,693.13 16,690.08 15,117.40 8,446.38 30,452.22 14,940.10 18.40 431.73 14,467.77 329.39 291.77 3,284.23 8,037.77 1,291.64 1,897.24 447.45 217.84 6.56 |
14.28 11.14 7.24 6.56 3.66 13.21 6.48 0.01 0.19 6.27 0.14 0.13 1.42 3.49 0.56 0.82 0.19 0.09 0.003 |
| Total 89,090.11 | ||
Source: Manatee River Comprehensive Watershed Management Plan, p. 2-9
Agriculture is by far the largest land use within the Manatee River watershed. Agriculture consists primarily of vegetable crops, citrus, and livestock. Overall, the 1992 Census of Agriculture showed that agricultural land comprised nearly 92,980 acres within the watershed. Agricultural land use represents roughly 40 percent of the total land area of the watershed. Of that total, about 75,073 acres (about 33 percent of the watershed) are in cropland and pastureland and about 13,951 acres (6 percent) are in tree crops, mainly citrus. In 1992, Manatee County ranked sixth in the state in the value of all agricultural products sold and eighth in average per farm sales. It ranked sixth in the state in 1992 for the value of crop sales, and ranked ninth in total citrus acreage. In 1994, Manatee County had about 10,800 acres in tomatoes, 2.800 acres in watermelons, and 1,070 acres in cucumbers. This represents about 23.4 percent, 44.8 percent, and 26.4 percent, respectively, of the 1994 statewide acreage.
The greatest change occurring within the County since the 1987 Agricultural Census has been increases in harvested and irrigated cropland and an increase in citrus production. During this period, total land in agriculture declined by some 30,000 acres (9%) and the number of farms declined by 38 (5%) while cropland acreage increased by about 18,600 acres (18%), citrus increased by about 10,000 acres (58%) and pasture lands decreased by about 30,400 acres (14%) (Table 2.4).
Table 2-4: 1995 Generalized Agricultural Land Use in the Manatee River Watershed
| Land Use | Acreage | Land Percent of Agri. In Watershed |
Percent of Watershed |
| Cropland and Pastureland Row Crops Tree Crops Feeding Operations Nurseries and Vineyards Specialty Farms Rural Open Lands |
49,576.37
25,497.30 13,951.83 720.52 510.08 382.11 2,341.27 |
53.5 27.4 15.0 0.8 0.6 0.4 2.5 |
21.5 11.1 6.1 0.3 0.2 0.2 1.0 |
| Total 92,979.48 40.32 | |||
Source: Manatee River Comprehensive Watershed Management Plan, p. 2-11
Sinkholes are a common feature of Florida's landscape. They are only one of many kinds of karst landforms, which include caves, disappearing streams, springs, and underground drainage systems, all of which occur in Florida. Karst is a generic term which refers to the characteristic terrain produced by erosional processes associated with the chemical weathering and dissolution of limestone or dolomite, the two most common carbonate rocks in Florida. Dissolution of carbonate rocks begins when they are exposed to acidic water. Most rainwater is slightly acidic and usually becomes more acidic as it moves through decaying plant debris.
Limestones in Florida are porous, allowing the acidic water to percolate through their strata, dissolving some limestone and carrying it away in solution. Over eons of time, this persistent erosional process has created extensive underground voids and drainage systems in much of the carbonate rocks throughout the state. Collapse of overlying sediments into the underground cavities produces sinkholes.
(http://www.dep.state.fl.us/geology/geologictopics/sinkhole.htm)
The three general types of sinkholes -- subsidence, solution, and collapse -- generally correspond to the thickness of the sediments overlying the limestone of the Floridan aquifer system. The sediments and water contained in the unsaturated zone, surficial aquifer system, and the confining layer above the Floridan are all collectively referred to as overburden. Collapse sinkholes are most common in areas where the overburden is thick, but the confining layer is breached or absent. Subsidence sinkholes form where the overburden is thin and only a veneer of sediments is present overlying the limestone. Solution sinkholes form where the overburden is absent and the limestone is exposed at land surface.
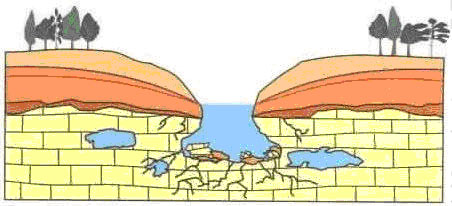
Collapse sinkholes are the most dramatic of the three sinkhole types; they form with little warning and leave behind a deep, steeply sided hole. Collapse occurs because of the weakening of the rock of the aquifer by erosion and is often triggered by changes in water levels in the surficial and Floridan aquifers. The progression of a collapse sinkhole is shown below.
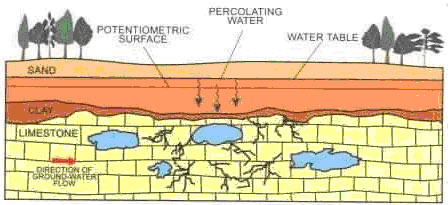
(1) No evidence of land subsidence,
small- to medium-sized cavities in the rock matrix. Water from surface
percolates through to rock, and the erosion process begins.
(2) Cavities in limestone continue to
grow larger. Note missing confining layer that allows more water to flow through
to the rock matrix. Roof of the cavern is thinner, weaker.
(3) As groundwater levels drop during
the dry season, the weight of the overburden exceeds the strength of the cavern
roof, and the overburden collapses into the cavern, forming a sinkhole.
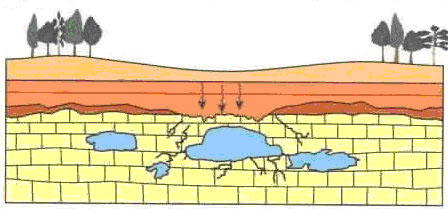
The progression of a subsidence
sinkhole is shown in the following three diagrams. Rainwater percolates through
overlying sediments and reaches the limestone, dissolving the rock and gradually
weakening its structural integrity. Gradually subsiding sinkholes commonly form
where slow dissolution takes place, mostly along joints in the limestone. These
sinkholes tend to form naturally and are not greatly affected by human
activities.
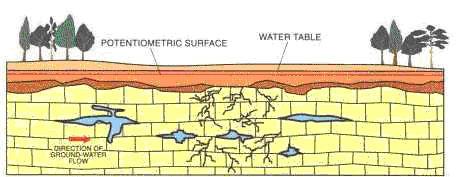
(1) Initially the limestone contains
fractures, but no subsidence has occurred. Potentiometric surface may coincide
with the water table.
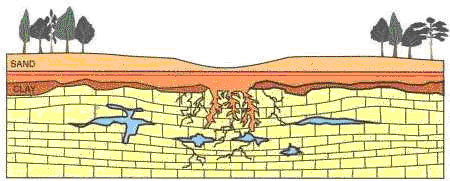
(2) Small cavities and cracks grow larger as time progresses, and water moving
through the rock erodes the rock matrix. Sediments carried by the water fill the
voids in the rock.
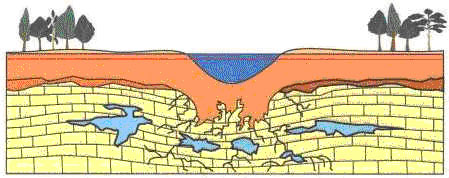
(3) Sediments from the upper layers
continue to fill in the openings in the limestone, causing a depression at the
land surface. If water collects in the depression, a new lake is formed.
source: http://waterquality: Hydrology of Central Florida Lakes--A Primer.
At least eight Southwest Florida Water Management District programs monitor, protect or improve the quality of ground water, the primary source of drinking water in the District. Ground-water contamination can be caused by a number of things, including: nitrates from fertilizer or other sources, injection wells, drainage wells, underground storage tanks, pesticides, septic tanks, landfills, industrial waste sites, lawn and landscape maintenance, polluted surface waters, and chemical spills. Drought and excessive pumping can cause surface water to be pulled down into the groundwater system, sometimes doing harm to groundwater quality. Reductions in levels of fresh ground water can lead to saltwater intrusion, adversely affecting water quality.
Groundwater monitoring has detected a significant and growing problem in water quality: saltwater intrusion into the aquifers. High pumping rates in low recharge areas along the coast, especially in the southern part of the District, allow salt water to intrude inland, contaminating fresh water in the aquifer. Saltwater intrusion has been identified in southern Hillsborough, Manatee and northern Sarasota counties. Impacts to the surface environment and saltwater intrusion have also been identified in Pinellas County and other parts of the Tampa Bay area. Another issue of groundwater quality is recharge protection: ensuring an adequate quantity of good quality water is available for recharge when and where aquifers need it. A principal method by which the District achieves regional recharge protection is through environmental resource permits. These permits regulate how development impacts the water supply in a variety of ways.
Manatee Population
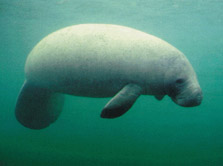
Figure 2.2: Manatee in Florida waters.
The endangered manatee is one of the most unique and best known Florida animals (figure 2.2). Ongoing USGS research is providing wildlife managers with the tools necessary for the recovering populations of this marine mammal. USGS biologists with the Sirenia project are conducting long-term studies on the manatee's life history, population dynamics, and ecological requirements, and have pioneered several important tools, including a computerized photo-identification catalog and a radio-tag assembly for tracking manatees by satellite. Scientists also are studying manatee feeding habits and seagrass ecology in high-use manatee areas; the long-term, post-release success of manatees rehabilitated in captivity; manatee population genetics; and the effects of eliminating industrial warmwater discharges on manatee habitats. Warm water discharges from industrial sources help keep manatees warm in cold weather. The results of these studies will assist natural resources managers in determining factors important to manatee distribution patterns, fitness and ultimate survival. USGS Sirenia Project personnel are active members of the Florida Manatee Recovery Team, an interagency team under the direction of the U.S. Fish and Wildlife Service, which guides manatee research and management activities. (http://water.usgs.gov/pubs/FS/FS-010-99/)
Manatees, found in the southeastern United States and in the Caribbean Sea as far south as Brazil, live in Florida year-round. Manatees have a grayish, seal-like body that tapers to a flat, paddle-shaped tail. They grow to an average length of 10 feet and can weigh more than 1,200 pounds and consume 100 pounds of seagrass or other aquatic vegetation each day! Manatee populations in Tampa Bay have been gradually increasing, especially in the winter when more than 200 gather near the warm-water outfalls of power plants to escape the cold. However, collisions with boats, entanglement in crab traps or fishing nets and natural threats such as red tide continue to jeopardize their long-term survival. Collisions with boat hulls and propellers that slice their thick hides injure and kill countless manatees each year. Virtually all manatees in Florida bear tell-tale scars of impacts with boats.
Emergent wetlands decreased from 29,000 ha (71,700 acres) in the 1950's to 23,900 ha (59,100 acres) in 1982, about an 18% loss. Mangroves decreased from 8,629 ha (21,320 acres) to 8,032 ha (19,847 acres), a decline of about 7%. Salt marshes declined from 2,063 ha (5,097 acres) to 1,423 ha (3,538 acres), or a loss of 30%. Freshwater wetlands decreased 21% from 18,335 ha (45,305 acres) to 14,440 ha (35,681 acres). It is estimated that 44% of the salt marsh and mangrove has been lost in Tampa Bay since the late 1800's. Although these numbers are not readily comparable because of differences in time frame, methodology, vegetation classification, and area mapped, the results taken together confirm that significant losses of wetland habitat have occurred. Marsh and mangrove losses are the product of dredge and fill activities that are now under strict regulatory control; although permitted dredging continues, protective measures exist to minimize loss that is not for public benefit (Handley 1995a).
Florida’s population has increased greatly over the past 30 years and Manatee County has experienced growth in excess of 43 percent between the 1980 and 1990 Census. The majority of growth can be attributed to the large number of retirees and others attracted to the mild climate and recreational opportunities in west central Florida. Most population growth is a result of migration. Over 28 percent of the population is over the age of 65. Population growth is expected to continue. Significant annual population fluctuations occur during “the season,” generally from Christmas to Easter (Manatee River Comprehensive Watershed Management Plan).
Most residents in the Manatee County live within the narrow corridor (which varies from three to ten miles wide) between the Gulf coast and I-75. Future growth is expected to occur within this corridor or a few miles further east. Urban sprawl is an issue that is of concern to local government and residents. The County has recently created the Future Development Area Boundary (FDAB) to direct development by providing central water and sewer services to designated service areas and to discourage development outside of those areas by not providing a full range of municipal services (Manatee River Comprehensive Watershed Management Plan).
Water availability, quantity, and quality influence decisions for development. As part of the local government comprehensive planning process, future land use needs are estimated on the basis of projected population growth and appropriate levels of development required to adequately serve them in terms of housing, employment, services, etc. Future land use within the Manatee River Watershed is expected to be similar to existing uses with some exceptions. About 22,930 acres have been identified as land acquisition priorities in the Manatee River Watershed and, as of 2001, about 6,973 acres have been purchased under SOR/P2000 (Figure 2.5) (SWFWMD, 2000).
Table 2-5: 2010 Generalized Future Land Use for the Manatee River Watershed
| Land Use – Land Cover | Total Acres | Percent of Watershed |
| Agriculture Estates Residential Single Family Residential Multi-family Residential Industrial Commercial Preservation Water |
93,637.26
13,841.98 54,683.67 20,543.07 5,070.04 6,638.78 24,034.84 11,169.32 |
41.0 6.0 23.7 8.9 2.2 2.9 10.4 4.8 |
| Total 230,618.88 | ||
Source: Manatee River Comprehensive Watershed Management Plan, p. 2-10
Service and retail industries dominate Manatee County’s employment sector and comprise about one half of the jobs covered by unemployment compensation. This is typical of counties with large populations of retirees, seasonal visitors, tourists and other immigrants. Manufacturing plays a significant role in the County and about 13.8 percent of employment is well about the State average of 8.0 percent, which is a result of the roles that agriculture and Port Manatee have in the regional economy (Manatee River Comprehensive Watershed Management Plan).
The Tampa Bay Estuary Program
The Southwest Water Management District
The Integrated Study: The Tampa Bay Program
http://floridaconservation.org/psm/habitat/habrep.pdf
http://gulfsci.usgs.gov/tampabay/reports/mcivor1/index.html
http://www.dep.state.fl.us/geology/geologictopics/sinkhole.htm
Carlton, J.M. 1975. A guide to common Florida salt marsh and mangrove vegetation. Florida Department of natural resources Marine Research Publication Number 6. FDNR marine Research Laboratory, St. Petersburg, FL. 30p.
Davis, H.J. 1940. The Ecology and Geologic Role of Mangroves in Florida. Pps. From Tortugas Lab., Vol. 32. Carnegie Inst. Wash. Pub. NN517.
Haddad, K.D. 1989. Habitat trends and fisheries in Tampa and Sarasota Bays, pp. 113-128. In: Esteves, E.D. (ed.), Tampa and Sarasota Bays: Issues, Resources, Status and Management. NOAA, Washington, D.C.
Lewis, R.R., and F.M. Dunstan. 1976. Possible role of Spartina alterniflora Loise. In establishment of mangroves in Florida. Pp. 81-100 in Lewis R.R. (ed.) Proc. 2nd Ann. Conf. Coastal Vegetation in Florida. Hillsborough Community College, Tampa.
Lewis, R.R. 1982a. Low marshes, peninsular Florida. Ch. 7, pp. 147-152 in Lewis, R.R. (ed.), Creation and Restoration of Coastal Plant Communities. CRC Press, Boca Raton, FL.
Lewis, R.R. 1982b. Mangrove forests. Ch. 8, pp. 154-171 in Lewis, R.R. (ed.), Creation and Restoration of Coastal Plant Communities. CRC Press, Boca Raton, FL.
Schomer, N.S., R.D. Drew, and P. Johnson. 1990. Vegetation communities (habitats). Ch 5, pp. 132-215, in Wolfe, S.H., and R.D. Drew (eds.), An Ecological Characterization of the Tampa Bay Watershed. Biological Report 90(20), Fish and Wildlife Service and Minerals Management Service, U.S. Department of the Interior.
Scott, T.M. and P.L. MacGill. 1981. The Hawthorne Formation of Central Florida, Florida Bureau of Geology, R.I. 91.
SWFWMD. 1988a. Ground-Water resource Availability Inventory: Manatee County, Florida. Brooksville, Florida.
SWFWMD. 1988b. Water management Lands Trust Funds-Save Our Rivers/Preservation 2000 1998 Five-Year Plan. Brooksville, Florida.
SWFWMD. 2000. Water management Lands Trust Fund-Save Our Rivers/Preservation 2000 2000 Five-Year Plan. Brooksville, Florida.
SWFWMD. 2001. Manatee River Comprehensive Watershed Management Plan, April 26, 2001.
White, W. H. 1970. The Geomorphology of the Florida Peninsula. Geological Bulletin No. 51. Bureau of Geology, Department of Natural Resources. Tallahassee, Florida.