Crescent Lake Background Information
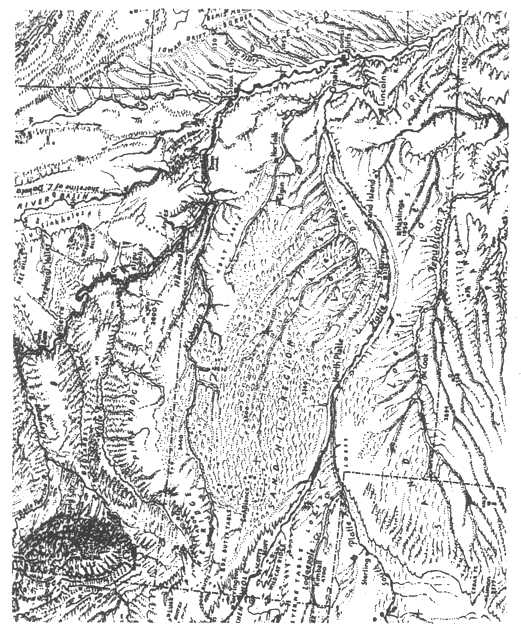
Figure 1: The Nebraska Sand Hills
Range Management Vs. Grazing by Ranchers
Background Information
Crescent Lake
Summary information on Crescent Lake National Wildlife Refuge and the Nebraska Sandhills is a compilation of reports, articles, books, Open File government documents, Internet accessible data, and interviews with experts on the Sandhills, wetlands, and change. Only direct quotes or facts are cited. General information from multiple sources and data from Internet websites are not cited. References consulted are located at the end of this summary
The Nebraska Sand Hills are a distinct, geographical region of the American Great Plains. Human occupants have created a way of life that provides a sense of internal cohesion. The Sand Hills cover approximately one-fourth of the Nebraska, or about 22,000 square miles (Macintosh 1996, 1). Besides Nebraska, eleven other western states have scattered sand dunes, but Nebraska has the largest area of sandhills found within the United States.
The Sand Hills region was primarily occupied by Native Americans until the government moved the natives onto reservation in the 1850s. After the land was opened for settlement in the 1880s, cattle were introduced to the area, and by the early 20th Century Nebraska ranked third in total cattle with over 4.5 million head of cattle (McIntosh 1997, 168). Railroad development of the Sand Hills is probably the single most import agent that encouraged settlement after 1880, although, the Homestead Act and the Kinkaid Law of 1904 brought settlers into the Sand Hills and ended the days of free range. Settlers tried to farm the land, but the almost pure sand soil resulted in poor to no crops. Land was sold for unpaid taxes, and the region reverted to livestock ranching, the current land use for the Sand Hills region.
The Sand Hills of Nebraska lie between the 99th and the 103rd meridians and includes about 22, 000 square miles of dune topography (Figure 1). The many lakes found between lines of sandhills owe their origin to drifting sand. Although vegetation anchors the dunes in place, bare, open areas of drifting sand still exist today. Variations in seasonal rainfall result in some years with lush grass-vegetation abating dune movement, while drier rainfall seasons contribute to wind erosion and slight shifting of dunes (Fenneman 1931, 21). The ultimate source of water for the Sandhills is precipitation which directly affects lake levels. The Sandhills receive enough precipitation within an average year (18-21 inches) to support tall grass prairie and trees. However, as within all semi-arid environments evaporation rates usually exceed precipitation (Table 1), and
Figure 1: The Nebraska Sand Hill Region
Average Rainfall Patterns By County
1950-1997
| GARDEN Cresent Lake |
SHERIDAN Ellsworth |
DEUEL Big Springs |
|||||||
| AVG JAN |
AVG JUL |
AVG ANN |
AVG JAN |
AVG JUL |
AVG ANN |
AVG JAN |
AVG JUL |
AVG ANN |
|
| 1950 to 1954 | .36 | 3.43 | 12.98 | .16 | 3.34 | 14.83 | .16 | 3.35 | 16.14 |
| 1955 to 1959 | .27 | 2.01 | 17.30 | .19 | 2.48 | 17.05 | .24 | 3.16 | 18.07 |
| 1960 to 1964 | .20 | 2.62 | 21.46 | .04 | 1.91 | 14.53 | .29 | 2.42 | 16.11 |
| 1965 to 1969 | .33 | 3.04 | 17.03 | .26 | 3.02 | 15.84 | .26 | 2.38 | 16.85 |
| 1970 to 1974 | .41 | 2.07 | 11.60 | .39 | 2.54 | 14.22 | .38 | 1.61 | 21.19 |
| 1975 to 1979 | .34 | 2.84 | 17.90 | .24 | 3.00 | 16.07 | .52 | 2.50 | 17.21` |
| 1980 to 1984 | .30 | 1.68 | 14.96 | .19 | 2.16 | 13.40 | .42 | 1.86 | 15.03 |
| 1985 to 1989 | .18 | 2.16 | 16.47 | .16 | 2.50 | 14.24 | .39 | 2.33 | 16.45 |
| 1990 to 1994 | .30 | 2.60 | 12.55 | .17 | 2.02 | 14.32 | .73 | 2.43 | 15.58 |
| 1995 to 1997 | .16 | 1.80 | 10.02 | .24 | 2.12 | 15.38 | .56 | 3.04 | 16.56 |
| MORRILL Bridgeport |
GRANT Hyannis |
ARTHUR Arthur |
|||||||
| AVG JAN |
AVG JUL |
AVG ANN |
AVG JAN |
AVG JUL |
AVG ANN |
AVG JAN |
AVG JUL |
AVG ANN |
|
| 1950 to 1954 | .13 | 2.19 | 13.39 | .19 | 3.95 | 19.41 | .16 | 3.40 | 14.70 |
| 1955 to 1959 | .23 | 2.69 | 16.99 | .17 | 3.27 | 15.30 | .25 | 3.6 | 18.84 |
| 1960 to 1964 | .31 | 2.53 | 12.41 | .23 | 5.72 | N/A | .21 | 5.51 | 19.30 |
| 1965 to 1969 | .35 | 2.11 | 16.83 | .46 | 4.76 | N/A | .32 | 4.75 | 20.06 |
| 1970 to 1974 | .41 | 2.41 | 14.55 | .26 | 3.26 | 19.01 | .39 | 2.72 | 18.25 |
| 1975 to 1979 | .61 | 2.50 | 15.19 | .47 | 3.59 | 20.09 | .55 | 3.23 | 18.09 |
| 1980 to 1984 | .26 | 3.45 | 16.81 | .35 | 2.77 | 19.85 | .25 | 3.15 | 17.99 |
| 1985 to 1989 | .18 | 1.47 | 14.95 | .23 | 2.62 | 17.17 | .23 | 2.66 | 17.75 |
| 1990 to 1994 | .47 | 2.72 | 16.72 | .40 | 3.36 | 19.38 | .55 | 4.77 | 21.14 |
| 1995 to 1997 | .32 | 1.28 | 10.48 | .46 | 3.18 | 28.00 | .06 | 2.59 | 17.53 |
Monthly Rainfall Listing
| Crescent Lake Nat WLR | Station No. 2000 | ||||||||||||
| Monthly Rainfall in Inches | |||||||||||||
| YEAR | JAN | FEB | MAR | APR | MAY | JUN | JUL | AUG | SEP | OCT | NOV | DEC | ANNUAL |
| 1972 | 0.48 | 0.02 | 0.28 | 2.97 | 1.25 | 4.03 | 2.86 | 0.44 | 2.58 | 0.31 | 1.34 | 0.29 | 16.85 |
| 1973 | 0.58 | 2.38 | 2.58 | 1.97 | 0.99 | 2.08 | 1.35 | 7.44 | 0.83 | 1.16 | 0.46 | ||
| 1974 | 0.32 | 0.07 | 0.72 | 2 | 1.88 | 2.34 | 0.81 | 2.23 | 0.75 | 0.28 | 0.1 | 0.2 | 11.7 |
| 1975 | 0.04 | 0.32 | 1.83 | 1.18 | 3.98 | 2.63 | 1.76 | 1.4 | 0.33 | 0.37 | 0.55 | 0.48 | 14.87 |
| 1976 | 0.74 | 0.11 | 0.27 | 2.47 | 4.04 | 2.19 | 1.89 | 1.4 | 0.47 | 0.54 | 0.05 | 0.08 | 14.25 |
| 1977 | 0.07 | 0.23 | 1.47 | 3.15 | 3.56 | 4.71 | 2.23 | 3.37 | 0.43 | 0.62 | 1.01 | 0.24 | 21.18 |
| 1978 | 0.64 | 1.03 | 0.14 | 2.15 | 4.54 | 1.77 | 3.23 | 3.44 | 0.32 | 0.42 | 0.44 | 1.17 | 19.29 |
| 1979 | 0.2 | 0.01 | 1.37 | 1.55 | 2.27 | 3.82 | 5 | 1.03 | 1.63 | 1.84 | 1.14 | 0.06 | 19.92 |
| 1980 | 0.49 | 0.56 | 2.3 | 0.75 | 4.03 | 2.3 | 0.47 | 1.62 | 0.28 | 0.56 | 0.15 | 0.13 | 13.64 |
| 1981 | 0.34 | 0.06 | 1.23 | 1.1 | 4.64 | 1.14 | 3.58 | 1.18 | 0.25 | 2.63 | 0.55 | 0.21 | 16.91 |
| 1982 | 0.18 | 0.17 | 0.43 | 0.72 | 2.2 | 2.59 | 2.74 | 0.97 | 1.5 | 1.32 | 1.46 | 0.45 | 14.73 |
| 1983 | 0.21 | 0 | 2.24 | 1.32 | 4.75 | 3.51 | 0.69 | 0.46 | 0.44 | 0.5 | 1.48 | 0.24 | 15.84 |
| 1984 | 0.28 | 0.41 | 0.75 | 2.74 | 1.93 | 3.74 | 0.9 | 0.42 | 0.32 | 1.32 | 0.4 | 0.49 | 13.7 |
| 1985 | 0.32 | 0.05 | 0 | 0.9 | 3.37 | 1.5 | 2.91 | 0.81 | 2.63 | 0.85 | 1.04 | 0.66 | 15.04 |
| 1986 | 0 | 1.4 | 0.55 | 2.83 | 2.02 | 3.77 | 1.68 | 0.47 | 2.36 | 1.29 | 0.32 | 0.16 | 16.85 |
| 1987 | 0.03 | 1.42 | 1.17 | 0.69 | 8.06 | 1.62 | 1.94 | 2.69 | 1.75 | 0.46 | 0.72 | 0.56 | 21.11 |
| 1988 | 0.53 | 0.09 | 0.5 | 0.66 | 7.06 | 2.06 | 4.07 | 1.89 | 1.09 | 0.12 | 0.14 | 0.21 | 18.42 |
| 1989 | 0 | 0.49 | 0.55 | 0.39 | 2.25 | 0.52 | 0.21 | 1.52 | 4.33 | 0.21 | 0.07 | 0.39 | 10.93 |
| 1990 | 0.34 | 0.17 | 2.27 | 2.03 | 2.7 | 3.19 | 2.72 | 1.07 | 1.93 | 1.07 | 1.26 | 0.25 | 19 |
| 1991 | 0.1 | 0.16 | 0.87 | 1.35 | 3.38 | 6.02 | 0.27 | 1.27 | 2.64 | 0.92 | 0.51 | 0.03 | 17.52 |
| 1992 | 0.93 | 1.24 | 0.84 | 1.24 | 4.46 | 2.11 | 3.66 | 1.46 | 1.23 | 0.6 | 0.16 | ||
| 1993 | 0.29 | 0.92 | 1.74 | 2.27 | 2.75 | 4.61 | 3.39 | 4.13 | 2.87 | 2.06 | 0.96 | 0.23 | 26.22 |
| 1994 | 0.76 | .023 | 0.4 | 0.87 | 2.11 | 1.13 | 4.5 | 3.42 | 0.53 | 0.53 | |||
| 1995 | 0.13 | 0.23 | 0.34 | 2.64 | 3.22 | 3.66 | 2.32 | 2.27 | 0.83 | 1.18 | 0.39 | 0.01 | 17.22 |
| 1996 | 0.4 | 0 | 0.47 | 1.55 | 4.68 | 2.61 | 1.91 | 3.53 | 2.87 | 0.26 | 0.34 | 0.13 | 18.75 |
| 1997 | 0.29 | 0.23 | 0.18 | 0.84 | 2.34 | 2.91 | 2.4 | 1.23 | 1.68 | 1.58 | 0 | 0.44 | 14.12 |
| Mean: | 0.31 | 0.38 | .085 | 1.51 | 3.31 | 3.09 | 2.45 | 1.92 | 1.59 | 0.93 | 0.5 | 0.3 | 17.19 |
coupled with the extremely porous sandy soils water does not remain in the upper portions of the soil for very long.
The sandhills form a linear pattern east to west, and many hills have relief of up to 100 feet. Flat valleys lie between the hills. These valleys contain high water tables, which result in grasses that are suitable for livestock ranching and irrigating crops such as hay.
One of the earliest descriptions of the sandhills by F.V. Hayden, a geologist-paleontologist, explains the topography:
"The surface [of the Sand Hills] is dotted with conical hills of moving sand. These hills often look like craters of small basins, the wind whirling and...scooping out sand, leaving innumerable depressions with a well-defined circular rim (McIntosh 1996, 6).
The dunes were formed by wind, and remain anchored because of vegetation. When the wind blows across the hills, vegetation hold the soil in place. During periods of severe drought, the soil is unable to maintain the appropriate amount of moisture to sustain vegetation; hence, the dunes are vulnerable to change. The wind blows across the sand dunes, and after an extended amount of time, the roots of the vegetation become exposed and are unable to anchor the soil. This process causes a change in the sand dunes.
The soils of the sandhills are not fertile or as productive as soils found in other parts of Nebraska. Where soils are found they are generally a fine loess that is easily eroded if the grass covering is removed.
The settlement pattern and population density of a region depends on many factors including site specific features such as water (settling along rivers, streams, lakes, and wetlands), access to transportation and markets, and availability of indigenous elements (once identified as having a use, elements become re sources). Perceptions, culture practices, and historical traditions especially influence settlement and land use choices. People tried to farm the sandhills, but found it impossible to earn a living from poor sandy soils unsuitable for traditional crops.
Population density varies due to the distance to the nearest market or urban center. The orientation of dominant east-west roads and minimal north-south roads exacerbate isolation of the Sand Hills as a dominate theme. Isolation also creates special problems and needs, such as educational resources, declining population, and minimal development of towns providing services.
Land use of a given area is shaped by the land itself, and by attitudes, perceptions, and public policies. Culture and economics also play important roles in how land is used. For the Sand Hills, little has changed in land use patterns since ranching became the predominant economic occupation.
Livestock ranching is the mainstay within the Sandhills region. Most of the Nebraska Sand Hills supports large ranches with livestock grazing on natural grasses. Cattle-ranching remains the universally acknowledge economic stability for the Sand Hills with the form slightly modified over time, but not its function.
Farming supplements ranching with hay for livestock and provides cash crops as additional income and as an immediate food source. Hay is raised along steams and in the larger flat valley between the dense valleys. Almost all hay production is irrigated form streams, and lake surface water and ground water. The rolling hills and dry valleys are used for grazing. The principal irrigated crop is corn, found mostly in the eastern Sand Hills. The low percentage of cropland in counties of the Sand Hills support the hypothesis of minimal farming mixed with a preponderance of livestock ranching.
The Nebraska Sand Hills covers approximately 22,000 square miles and contains over 1.2 million wetland acres including an estimated 177,000 acres of open water and marsh and 1,130, 000 acres of wet meadows (LaGrange 1997, 16). Some wetlands within the Western Sand Hills actually are depressions, that is they do not have water, but there is emergent vegetation in these areas that is seasonally flooded by fresh water. According to LaGrange (197,17), most wetlands within the sand hills are
"freshwater wetlands and include saturated wet meadows, shallow marshes, and open water lakes. The wetlands range in size from less than one acre to 2,300 acres with greater than 80% of all wetlands estimated to be 10 acres or less in size."
The actual formation of the sandhills wetlands are a "result of sand-blocked river valleys, called dune dams that formed during dry periods about 11,000 to 12,000 years ago and again 5,500 to 6,500 years ago" (Wetlands: Understanding a Resource 1998, 2).
Wetland serve many functions. Sandhills wetlands are very valuable to the ranchers and ranching economy. They offer a water source for livestock, grazing sites, and a habitat for numerous plant and animal species. The wetlands meadows provide winter feed for cattle. The Sand Hills wetlands also serve as ground water discharge and recharge sites.
Crescent Lake National Wildlife Refuge
The Crescent lake National Wildlife refuge is located 28 miles north of Oshkosh, and encompasses about 46,000 acres or 70 square miles. When the continuing decline of waterfowl was recognized as a national issue in the late 1920s, a refuge was established in the sandhills, a region that provided abundant food and cover for migrating and nesting water fowl. Crescent Lake National Wildlife Refuge became a reality in 1931.
Many of the Refuge’s wetlands are facing eutrophication, which is the closing in of wetlands. A proposed policy is to maintain affected wetlands by artificial means. For example, scratching-up lake bottoms so that wind erosion will continue to create wetlands, and the building of a structure to manage water levels on seven susceptible ponds. A third proposal is the reintroduction of bison on the Refuge. Instead of treating them as livestock, however, the plan it to consider the bison as wildlife, culling the herd only when necessary.
The main focus of the Refuge is to maintain a prairie ecosystem as it might have appeared to the first European settlers. Considerable effort is spent on maintaining the habitat free of introduced biological species such as the carp or noxious weeds that have invaded and changed the landscape. Eradication programs for noxious weeds and species, prescribed burns, and grazing rotation policies that leave grasses undisturbed from year-to-year are among the methods used for managing the Refuge.
Several ecological issues exist within the western Sand Hills, especially the portion within the Crescent lake National Wildlife Refuge. Two concerns that currently are under scrutiny by the refuge management are blow-outs and noxious weed control.
Blow outs are sand dunes denuded of vegetation and eroded by wind. Areas where vegetation has been stripped by wind erosion, leave hollowed areas or blow-outs in the sides of sand hills. The blowouts show the process of change by wind erosion. The sand hills are anchored, yet active sand dunes and the blow-outs indicate active sand movement. The Crescent Lake National Wildlife Refuge management plan calls for the planting of Penstemon, a flowering plant, in blowouts, that, once sets its roots, is not as susceptible to erosion. Before the reintroduction of Penstemon, discarded tires were used to hold sand in place.
The Canadian thistle is an invasive noxious weed that the Refuge is trying to eradicate through pest control, spread of seeds, and use of chemicals.
Range Management Vs. Grazing by Ranchers
Controversy results from conversion of wetlands to other uses, the restoration of wetlands, or the designation of "new " areas that meet Federal and Nebraska guidelines as wetlands.
The rights of the sand hills rancher versus the management practices for the Crescent Lake National Refuge is an issue for ranchers adjacent to the Refuges and those using the Refuge’s grazing lands. The National Wildlife Refuge rents lands for grazing on a six-year rotation. The problem however, is that the Secretary of the Interior wants to raise grazing fees, which has caused local ranchers concern with current and future grazing practices.
The most recent controversial issue impacting both ranchers and the Refuge is Refuge’s proposal for one good road into the refuge. This presents several advantages for the Refuge. First, it will affect the ability of the Refuge to hire and retain staff. Second, it will allow better maintenance of the Refuge. The refuge plans to set public use limits that could adversely affect ranchers. Currently, the road proposal is before the state legislature, but a decision has not been made.
A dominant feature of the Sand Hills is water, both surface and groundwater,
Groundwater is water below the surface, while surface water includes rivers, lakes, and marshes. Because groundwater is abundant, most of the Sand Hills could be irrigated. However, irrigation of is not the best use of a water resource. Precipitation as a source of surface water in the form of lakes, ponds, steams, marshes, and wetlands provide water for livestock and for domestic use as well. Water table levels are very important to maintaining surface water areas and wetlands.
Water used by ranchers and farmers is a controversial issue within the Great Plains and specifically within the Nebraska Sand Hills. The major use of the Sand Hills marginal land is ranching rather than farming. Several droughts affected the Great Plains region and the eastern Sand Hills. Severe winds during the droughts of 1890 and 1930 and straight-line plowing methods exacerbated erosion (Borchert 1971, 6). Droughts left towns and cities of the Great Plains short of ground water. The western Sand Hills were not as adversely affected by later droughts (1950s, 1970s, 1980s) because of the differences in climate, rainfall pattern, and wetlands. Because the wetlands replenish and store surface water, in times of drought, the Sand Hills are not as desolate as other parts of the Great Plains and provide water for irrigation and livestock.
Fences, railroads, and land irrigation have affected habitats and changed the composition of wetlands. Soils, however, remain fine loess deposits that, while capable of supporting some crops, is best suited as grassland or for hay production. Modifications of the landscape by recreational use and ranching practices has caused changes to thee wetland and grassland habitats. Ranchers, through experiences and education, have altered grazing practices, e.g., size of "fields," changes from sheep to almost entirely cattle, fewer cattle per acre, improved pasture and haying practices, etc. These practices have helped eliminate overgrazing and promote good soil management and conservation of the wetlands and grasslands.
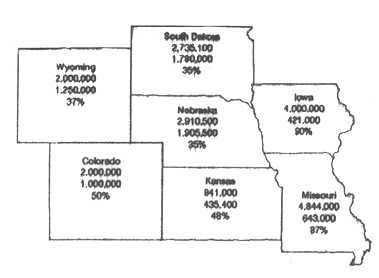
Nebraska is experiencing wetland loss. In 1867 Nebraska wetlands covered about six percent of the state-- an estimated 2.9 million acres. Between 1780 and 1980 of an estimated 35% of all Nebraska wetlands have been lost. This has been attributed to impacts from agriculture, transportation, and development (LaGrange 1997, 8) (Figure 2).
Figure 2: Estimated acres of wetlands in Nebraska and surrounding state between 1780 and 1980. (1780=top number; 1980=bottom number; percent loss= bottom number) Source: LaGrange 1997, 8
Much of the wetland change within the sandhills is due to modification of the region for economic prosperity. Over the years, many Nebraska wetlands were filled, ditched, channelized, and diverted into cropland. Often, boggy wetlands were permanently drained as an aid to cattle grazing and hay production. At the same time that wetlands were modified for other use, however, new wetlands were created from the building of farm and livestock ponds, and rising local water tables, which may be the result of localized increased use of irrigation, canal, and reservoir seepage.
A major initiative for Nebraska, as for other parts of the United States, is recognizing the values, functions, and importance of wetlands. The western Sand Hills have diverse habitats that rely on wetlands to maintain a balance within their ecosystem niche Preservation of the Sand Hills as habitat for migratory waterfowl and for other fish and wildlife, and for public use remains a primary goal for the Crescent Lake National Wildlife Refuge. Although conflicts between local ranchers’ land use practices and those of publicly managed lands have always been present, both groups realize the fragileness of the Sand Hills ecosystem and its place in the Nebraska and Great Plains economy.
Nebraska: FIPS.STATE=31
http://venus.census.gov/cdrom/lookup/928342391
PERSONS
Universe: Persons
Total.................................................................1578385
HOUSEHOLDS
Universe: Households
Total..................................................................602858
URBAN AND RURAL
Universe: Persons
Urban:
Inside urbanized
area................................................687898
Outside urbanized
area...............................................356110
Rural:
Farm.................................................................117658
Nonfarm..............................................................416719
AGE
Universe: Persons
Under 1 year............................................................21698
1 and 2 years...........................................................48422
3 and 4 years...........................................................49361
5 years.................................................................25004
6 years.................................................................24886
7 to 9 years............................................................76491
10 and 11 years.........................................................48972
12 and 13 years.........................................................45964
14 years................................................................22310
15 years................................................................22474
16 years................................................................22047
17 years................................................................21558
18 years................................................................22505
19 years................................................................24012
20 years................................................................22813
21 years................................................................21267
22 to 24 years..........................................................62552
25 to 29 years.........................................................124584
30 to 34 years.........................................................135209
35 to 39 years.........................................................124321
40 to 44 years.........................................................105281
45 to 49 years..........................................................80137
50 to 54 years..........................................................68649
55 to 59 years..........................................................67427
60 and 61 years.........................................................26967
62 to 64 years..........................................................40408
65 to 69 years..........................................................63525
70 to 74 years..........................................................54695
75 to 79 years..........................................................43747
80 to 84 years..........................................................32686
85 years and over.......................................................28413
SCHOOL ENROLLMENT AND TYPE OF SCHOOL
Universe: Persons 3 years and over
Enrolled in preprimary school:
Public
school.........................................................20573
Private
school........................................................11213
Enrolled in elementary or high school:
Public
school........................................................252412
Private
school........................................................31169
Enrolled in college:
Public
school.........................................................95889
Private
school........................................................22153
Not enrolled in school................................................1074856
INDUSTRY
Universe: Employed persons 16 years and over
Agriculture, forestry, and fisheries (000-039)..........................64381
Mining (040-059).........................................................2095
Construction (060-099)..................................................40821
Manufacturing, nondurable goods (100-229)...............................47720
Manufacturing, durable goods (230-399)..................................50624
Transportation (400-439)................................................37478
Communications and other public utilities (440-499).....................25032
Wholesale trade (500-579)...............................................35726
Retail trade (580-699).................................................138179
Finance, insurance, and real estate (700-720)...........................52137
Business and repair services (721-760)..................................35089
Personal services (761-799).............................................22449
Entertainment and recreation services (800-811)..........................8479
Professional and related services (812-899):
Health services
(812-840).............................................66275
Educational services
(842-860)........................................68165
Other professional and related services
(841, 861-899)................48154
Public administration (900-939).........................................30009
HOUSEHOLD INCOME IN 1989
Universe: Households
Less than $5,000........................................................33706
$5,000 to $9,999........................................................61896
$10,000 to $12,499......................................................34988
$12,500 to $14,999......................................................29673
$15,000 to $17,499......................................................34504
$17,500 to $19,999......................................................30938
$20,000 to $22,499......................................................34449
$22,500 to $24,999......................................................28563
$25,000 to $27,499......................................................31294
$27,500 to $29,999......................................................24974
$30,000 to $32,499......................................................29398
$32,500 to $34,999......................................................22894
$35,000 to $37,499......................................................24282
$37,500 to $39,999......................................................18717
$40,000 to $42,499......................................................21058
$42,500 to $44,999......................................................15447
$45,000 to $47,499......................................................15505
$47,500 to $49,999......................................................12102
$50,000 to $54,999......................................................22778
$55,000 to $59,999......................................................16162
$60,000 to $74,999......................................................29539
$75,000 to $99,999......................................................16607
$100,000 to $124,999.....................................................5828
$125,000 to $149,999.....................................................2479
$150,000 or more.........................................................5077
WAGE OR SALARY INCOME IN 1989
Universe: Households
With wage or salary income.............................................465731
No wage or salary income...............................................137127
NONFARM SELF-EMPLOYMENT INCOME IN 1989
Universe: Households
With nonfarm self-employment income.....................................82122
No nonfarm self-employment income......................................520736
FARM SELF-EMPLOYMENT INCOME IN 1989
Universe: Households
With farm self-employment income........................................57524
No farm self-employment income.........................................545334
Lewellen village: FIPS.STATE=31,
FIPS.PLACE90=26805
http://venus.census.gov/cdrom/lookup/928342185
PERSONS
Universe: Persons
Total.....................................................................298
HOUSEHOLDS
Universe: Households
Total.....................................................................141
URBAN AND RURAL
Universe: Persons
Urban:
Inside urbanized
area.....................................................0
Outside urbanized
area....................................................0
Rural:
Farm.....................................................................11
Nonfarm.................................................................287
AGE
Universe: Persons
Under 1 year................................................................2
1 and 2 years...............................................................1
3 and 4 years..............................................................17
5 years.....................................................................0
6 years.....................................................................9
7 to 9 years................................................................8
10 and 11 years.............................................................5
12 and 13 years.............................................................3
14 years....................................................................3
15 years....................................................................6
16 years....................................................................2
17 years....................................................................0
18 years....................................................................3
19 years....................................................................0
20 years....................................................................0
21 years....................................................................3
22 to 24 years.............................................................11
25 to 29 years..............................................................7
30 to 34 years.............................................................14
35 to 39 years.............................................................13
40 to 44 years.............................................................22
45 to 49 years.............................................................13
50 to 54 years.............................................................19
55 to 59 years.............................................................20
60 and 61 years.............................................................2
62 to 64 years..............................................................2
65 to 69 years..............................................................9
70 to 74 years.............................................................21
75 to 79 years.............................................................26
80 to 84 years.............................................................14
85 years and over..........................................................43
SCHOOL ENROLLMENT AND TYPE OF SCHOOL
Universe: Persons 3 years and over
Enrolled in preprimary school:
Public
school.............................................................5
Private
school...........................................................14
Enrolled in elementary or high school:
Public
school............................................................35
Private
school............................................................0
Enrolled in college:
Public
school.............................................................4
Private
school............................................................0
Not enrolled in school....................................................237
INDUSTRY
Universe: Employed persons 16 years and over
Agriculture, forestry, and fisheries (000-039).............................15
Mining (040-059)............................................................0
Construction (060-099)......................................................7
Manufacturing, nondurable goods (100-229)...................................0
Manufacturing, durable goods (230-399).....................................19
Transportation (400-439)....................................................9
Communications and other public utilities (440-499).........................0
Wholesale trade (500-579)...................................................0
Retail trade (580-699).....................................................17
Finance, insurance, and real estate (700-720)...............................3
Business and repair services (721-760)......................................1
Personal services (761-799).................................................2
Entertainment and recreation services (800-811).............................0
Professional and related services (812-899):
Health services
(812-840)................................................16
Educational services
(842-860)...........................................11
Other professional and related services
(841, 861-899)....................3
Public administration (900-939).............................................9
HOUSEHOLD INCOME IN 1989
Universe: Households
Less than $5,000............................................................9
$5,000 to $9,999...........................................................25
$10,000 to $12,499.........................................................19
$12,500 to $14,999..........................................................8
$15,000 to $17,499.........................................................19
$17,500 to $19,999..........................................................8
$20,000 to $22,499.........................................................10
$22,500 to $24,999..........................................................2
$25,000 to $27,499.........................................................12
$27,500 to $29,999.........................................................10
$30,000 to $32,499..........................................................0
$32,500 to $34,999..........................................................4
$35,000 to $37,499..........................................................0
$37,500 to $39,999..........................................................2
$40,000 to $42,499..........................................................4
$42,500 to $44,999..........................................................0
$45,000 to $47,499..........................................................3
$47,500 to $49,999..........................................................3
$50,000 to $54,999..........................................................3
$55,000 to $59,999..........................................................0
$60,000 to $74,999..........................................................0
$75,000 to $99,999..........................................................0
$100,000 to $124,999........................................................0
$125,000 to $149,999........................................................0
$150,000 or more............................................................0
WAGE OR SALARY INCOME IN 1989
Universe: Households
With wage or salary income.................................................81
No wage or salary income...................................................60
NONFARM SELF-EMPLOYMENT INCOME IN 1989
Universe: Households
With nonfarm self-employment income........................................20
No nonfarm self-employment income.........................................121
FARM SELF-EMPLOYMENT INCOME IN 1989
Universe: Households
With farm self-employment income...........................................15
No farm self-employment income............................................126
Oshkosh city: FIPS.STATE=31,
FIPS.PLACE90=37560
http://venus.census.gov/cdrom/lookup/928342043
Universe: Persons
Total....................................................................1005
HOUSEHOLDS
Universe: Households
Total.....................................................................450
URBAN AND RURAL
Universe: Persons
Urban:
Inside urbanized
area.....................................................0
Outside urbanized
area....................................................0
Rural:
Farm......................................................................0
Nonfarm................................................................1005
AGE
Universe: Persons
Under 1 year...............................................................22
1 and 2 years..............................................................17
3 and 4 years..............................................................32
5 years.....................................................................8
6 years....................................................................14
7 to 9 years...............................................................42
10 and 11 years............................................................25
12 and 13 years............................................................19
14 years....................................................................2
15 years....................................................................6
16 years...................................................................11
17 years....................................................................8
18 years...................................................................21
19 years....................................................................7
20 years...................................................................27
21 years....................................................................7
22 to 24 years.............................................................11
25 to 29 years.............................................................65
30 to 34 years.............................................................49
35 to 39 years.............................................................62
40 to 44 years.............................................................46
45 to 49 years.............................................................51
50 to 54 years.............................................................27
55 to 59 years.............................................................44
60 and 61 years............................................................24
62 to 64 years.............................................................37
65 to 69 years.............................................................76
70 to 74 years.............................................................73
75 to 79 years.............................................................56
80 to 84 years.............................................................75
85 years and over..........................................................41
SCHOOL ENROLLMENT AND TYPE OF SCHOOL
Universe: Persons 3 years and over
Enrolled in preprimary school:
Public
school............................................................17
Private
school............................................................2
Enrolled in elementary or high school:
Public
school...........................................................134
Private
school............................................................0
Enrolled in college:
Public
school............................................................24
Private
school............................................................6
Not enrolled in school....................................................783
INDUSTRY
Universe: Employed persons 16 years and over
Agriculture, forestry, and fisheries (000-039).............................34
Mining (040-059)............................................................0
Construction (060-099).....................................................21
Manufacturing, nondurable goods (100-229)...................................4
Manufacturing, durable goods (230-399).....................................91
Transportation (400-439)....................................................6
Communications and other public utilities (440-499).........................4
Wholesale trade (500-579)...................................................3
Retail trade (580-699).....................................................72
Finance, insurance, and real estate (700-720)...............................6
Business and repair services
(721-760)......................................6
Personal services (761-799).................................................8
Entertainment and recreation services (800-811).............................0
Professional and related services (812-899):
Health services
(812-840)................................................39
Educational services
(842-860)...........................................51
Other professional and related services
(841, 861-899)...................27
Public administration (900-939)............................................38
HOUSEHOLD INCOME IN 1989
Universe: Households
Less than $5,000...........................................................38
$5,000 to $9,999...........................................................86
$10,000 to $12,499.........................................................42
$12,500 to $14,999.........................................................29
$15,000 to $17,499.........................................................42
$17,500 to $19,999.........................................................36
$20,000 to $22,499.........................................................31
$22,500 to $24,999.........................................................16
$25,000 to $27,499.........................................................23
$27,500 to $29,999.........................................................12
$30,000 to $32,499.........................................................20
$32,500 to $34,999.........................................................13
$35,000 to $37,499..........................................................9
$37,500 to $39,999..........................................................7
$40,000 to $42,499..........................................................0
$42,500 to $44,999..........................................................4
$45,000 to $47,499..........................................................9
$47,500 to $49,999..........................................................4
$50,000 to $54,999..........................................................5
$55,000 to $59,999..........................................................9
$60,000 to $74,999..........................................................8
$75,000 to $99,999..........................................................4
$100,000 to $124,999........................................................0
$125,000 to $149,999........................................................0
$150,000 or more............................................................3
WAGE OR SALARY INCOME IN 1989
Universe: Households
With wage or salary income................................................281
No wage or salary income..................................................169
NONFARM SELF-EMPLOYMENT INCOME IN 1989
Universe: Households
With nonfarm self-employment income........................................49
No nonfarm self-employment income.........................................401
FARM SELF-EMPLOYMENT INCOME IN 1989
Universe: Households
With farm self-employment income...........................................34
No farm self-employment income............................................416
Arthur County
http://venus.census.gov/cdrom/lookup/928339628
PERSONS
Universe: Persons
Total.....................................................................462
HOUSEHOLDS
Universe: Households
Total.....................................................................186
URBAN AND RURAL
Universe: Persons
Urban:
Inside urbanized
area.....................................................0
Outside urbanized
area....................................................0
Rural:
Farm....................................................................254
Nonfarm.................................................................208
AGE
Universe: Persons
Under 1 year................................................................6
1 and 2 years..............................................................22
3 and 4 years...............................................................8
5 years.....................................................................3
6 years.....................................................................6
7 to 9 years...............................................................12
10 and 11 years............................................................14
12 and 13 years............................................................17
14 years...................................................................10
15 years....................................................................2
16 years....................................................................4
17 years...................................................................10
18 years...................................................................12
19 years....................................................................0
20 years....................................................................3
21 years....................................................................2
22 to 24 years.............................................................12
25 to 29 years.............................................................32
30 to 34 years.............................................................37
35 to 39 years.............................................................37
40 to 44 years.............................................................41
45 to 49 years.............................................................21
50 to 54 years.............................................................18
55 to 59 years.............................................................14
60 and 61 years............................................................13
62 to 64 years.............................................................21
65 to 69 years.............................................................18
70 to 74 years.............................................................25
75 to 79 years.............................................................26
80 to 84 years.............................................................10
85 years and over...........................................................6
SCHOOL ENROLLMENT AND TYPE OF SCHOOL
Universe: Persons 3 years and over
Enrolled in preprimary school:
Public
school.............................................................4
Private
school............................................................0
Enrolled in elementary or high school:
Public
school............................................................79
Private
school............................................................0
Enrolled in college:
Public
school............................................................15
Private
school............................................................0
Not enrolled in school....................................................336
INDUSTRY
Universe: Employed persons 16 years and over
Agriculture, forestry, and fisheries (000-039)............................117
Mining (040-059)............................................................0
Construction (060-099)......................................................7
Manufacturing, nondurable goods (100-229)...................................6
Manufacturing, durable goods (230-399)......................................4
Transportation (400-439)....................................................7
Communications and other public utilities (440-499).........................0
Wholesale trade (500-579)...................................................2
Retail trade (580-699).....................................................22
Finance, insurance, and real estate (700-720)...............................8
Business and repair services (721-760)......................................4
Personal services (761-799).................................................8
Entertainment and recreation services (800-811).............................0
Professional and related services (812-899):
Health services
(812-840).................................................0
Educational services
(842-860)...........................................25
Other professional and related services
(841, 861-899)....................4
Public administration (900-939).............................................4
HOUSEHOLD INCOME IN 1989
Universe: Households
Less than $5,000............................................................5
$5,000 to $9,999...........................................................21
$10,000 to $12,499.........................................................14
$12,500 to $14,999.........................................................27
$15,000 to $17,499.........................................................18
$17,500 to $19,999.........................................................13
$20,000 to $22,499.........................................................14
$22,500 to $24,999.........................................................18
$25,000 to $27,499..........................................................7
$27,500 to $29,999..........................................................7
$30,000 to $32,499..........................................................5
$32,500 to $34,999..........................................................8
$35,000 to $37,499..........................................................2
$37,500 to $39,999..........................................................6
$40,000 to $42,499..........................................................0
$42,500 to $44,999..........................................................0
$45,000 to $47,499..........................................................3
$47,500 to $49,999..........................................................6
$50,000 to $54,999..........................................................2
$55,000 to $59,999..........................................................5
$60,000 to $74,999..........................................................3
$75,000 to $99,999..........................................................2
$100,000 to $124,999........................................................0
$125,000 to $149,999........................................................0
$150,000 or more............................................................0
WAGE OR SALARY INCOME IN 1989
Universe: Households
With wage or salary income................................................140
No wage or salary income...................................................46
NONFARM SELF-EMPLOYMENT INCOME IN 1989
Universe: Households
With nonfarm self-employment income........................................38
No nonfarm self-employment income.........................................148
FARM SELF-EMPLOYMENT INCOME IN 1989
Universe: Households
With farm self-employment income...........................................72
No farm self-employment income............................................114
Garden County
http://venus.census.gov/cdrom/lookup/928283963
PERSONS
Universe: Persons
Total....................................................................2460
HOUSEHOLDS
Universe: Households
Total....................................................................1046
URBAN AND RURAL
Universe: Persons
Urban:
Inside urbanized
area.....................................................0
Outside urbanized
area....................................................0
Rural:
Farm....................................................................558
Nonfarm................................................................1902
AGE
Universe: Persons
Under 1 year...............................................................39
1 and 2 years..............................................................27
3 and 4 years..............................................................93
5 years....................................................................35
6 years....................................................................34
228
7 to 9 years...............................................................99
10 and 11 years............................................................69
12 and 13 years............................................................79
14 years...................................................................23
15 years...................................................................26
16 years...................................................................19
17 years...................................................................31
18 years...................................................................29
375
19 years...................................................................14
20 years...................................................................39
21 years...................................................................13
22 to 24 years.............................................................35 101
25 to 29 years............................................................139
30 to 34 years............................................................163
35 to 39
years............................................................152 454
40 to 44 years............................................................149
45 to 49 years............................................................154
50 to 54 years............................................................120
55 to 59 years............................................................159
60 and 61 years............................................................44
62 to 64 years.............................................................85 711
65 to 69 years............................................................137
70 to 74 years............................................................156
75 to 79 years............................................................104
80 to 84 years............................................................106 503
85 years and over..........................................................88
SCHOOL ENROLLMENT AND TYPE OF SCHOOL
Universe: Persons 3 years and over
Enrolled in preprimary school:
Public
school............................................................50
Private
school...........................................................16
Enrolled in elementary or high school:
Public
school...........................................................391
Private
school............................................................0
Enrolled in college:
Public
school............................................................45
Private
school............................................................6
Not enrolled in school...................................................1886
INDUSTRY
Universe: Employed persons 16 years and over
Agriculture, forestry, and fisheries (000-039)............................392
Mining (040-059)............................................................0
Construction (060-099).....................................................32
Manufacturing, nondurable goods (100-229)..................................31
Manufacturing, durable goods (230-399)....................................123
Transportation Communications and other public utilities........................30
Wholesale trade (500-579)...................................................5
Retail trade (580-699)....................................................154
Finance, insurance, and real estate (700-720)..............................15
Services.....................................151
HOUSEHOLD INCOME IN 1989
Universe: Households
Less than $5,000...........................................................78
$5,000 to $9,999..........................................................134
$10,000 to $12,499........................................................102
$12,500 to $14,999.........................................................57
$15,000 to $17,499........................................................111
$17,500 to $19,999.........................................................92
$20,000 to $22,499.........................................................63
$22,500 to $24,999.........................................................27
$25,000 to $27,499.........................................................76
$27,500 to $29,999.........................................................32
$30,000 to $32,499.........................................................30
$32,000 to $34,999.........................................................19
$35,000 to
$37,499.........................................................39
$37,500 to
$39,999.........................................................26
$40,000 to $42,499.........................................................15
$42,500 to $44,999.........................................................16
$45,000 to $47,499.........................................................16
$47,500 to $49,999.........................................................12
$50,000 to $54,999.........................................................16
$55,000 to $59,999.........................................................17
$60,000 to $74,999.........................................................54
$75,000 to $99,999.........................................................11
$100,000 to $124,999........................................................0
$125,000 to $149,999........................................................0
$150,000 or more............................................................3
MEDIAN HOUSEHOLD INCOME IN 1989
Universe: Households
Median household income in 1989.........................................18614
AGGREGATE HOUSEHOLD INCOME IN 1989
Universe: Households
Less than $150,000.........................................................24246808
$150,000 or more.............................................................468000
WAGE OR SALARY INCOME IN 1989
Universe: Households
With wage or salary income................................................687
No wage or salary income..................................................359
NONFARM SELF-EMPLOYMENT INCOME IN 1989
Universe: Households
With nonfarm self-employment income.......................................122
No nonfarm self-employment income.........................................924
FARM SELF-EMPLOYMENT INCOME IN 1989
Universe: Households
With farm self-employment income..........................................283
No farm self-employment income............................................763
SELECTED NEBRASKA SANDHILLS COUNTIES
POPULATION
by State, County, and City
TOTAL PERSONS 1910-1980
| 1910 |
1920 |
1930 |
1940 |
1950 |
1960 |
1970 |
1980 |
|
| Nebraska |
1,192,214 |
1,296,372 |
1,377,963 |
1,315,834 |
1,325,510 | 1,411,330 |
1,483,493 | 1,569,825 |
| Garden |
3,838 |
4,572 |
5,099 | 4,680 | 4,114 |
3,472 |
2,929 |
2,802 |
| Arthur |
- - - |
1,412 | 1,344 | 1,045 |
803 |
680 |
606 |
513 |
| Lewellen |
532 |
510 |
411 | 376 | 368 |
|||
| Oshkosh |
910 |
1124 |
1,025 |
1,067 |
1,057 |
TOTAL PERSONS Estimated 1990-1996
| 1990 |
1991 |
1992 |
1993 |
1994 |
1995 |
1996 |
|
| Nebraska |
1,578,417 |
1,580,622 | 1,590,734 |
1,602,444 |
1,612,336 |
1,621,808 |
1,635,414 |
| Garden
Co. |
2,460 |
2,445 |
2,356 |
2,331 | 2,271 |
2,285 |
2,225 |
| Arthur
Co. |
462 |
467 |
443 | 457 |
465 |
434 |
424 |
| Lewellen (city) |
307 |
296 |
293 |
285 |
288 | 281 | 282 |
| Oshkosh (city) |
986 |
946 |
937 |
916 |
921 |
897 |
904 |
Source:
http://census.gov
by State, County, and City
TOTAL PERSONS 1910-1980
| 1920 |
1930 |
1940 |
1950 |
1960 |
1970 |
1980 |
|
| Nebraska |
8.7 |
6.2 |
-4.5 |
-4.5 |
6.5 |
5.1 |
5.8 |
| Garden County |
19.1 |
11.5 |
-8.2 |
-8.2 |
-15.6 |
-15.6 |
-4.3 |
| Arthur County |
- - - |
-4.8 |
-22.2 |
-22.2 |
-15.3 |
-10.9 |
-15.3 |
| Lewellen (city) |
-19.4 |
-8.5 |
-2.1 | ||||
| Oshkosh (city) |
23.5 |
4 |
-.9 |
TOTAL PERSONS Estimated 1990-1996
| 1990 |
1991 | 1992 |
1993 |
1994 |
1995 |
1996 |
|
| Nebraska |
.6 |
.1 |
.6 |
.7 |
.6 |
.6 |
.8 |
| Garden County | -12.2 |
-.6 |
-3.6 |
-1.1 |
-2.6 |
.6 |
-2.3 |
| Arthur County |
-9.9 |
1 |
-5.1 |
3.2 |
1.8 |
-6.7 |
-2.3 |
| Lewellen (city) |
-16.6 |
-3.6 |
-1 |
-2.7 |
1 |
-2.4 |
.4 |
| Oshkosh (city) |
-6.7 |
-4.1 |
-1 |
-2.2 |
.5 |
-2.6 |
.8 |
1990 SCHOOL
ENROLLMENT AND TYPE OF SCHOOL
Persons 3 years and over
| STATE |
COUNTY |
CITY |
|||
| Nebraska |
Garden | Arthur | Lewellen |
Oshkosh | |
| Pre-primary School |
|||||
| Public school |
20573 | 50 |
4 | 5 | 17 |
| Private school |
11213 |
16 |
0 | 14 |
2 |
| Elementary/High School |
|||||
| Public school |
252412 |
391 |
79 |
35 | 134 |
| Private school |
31169 |
0 |
0 | 0 |
0 |
| College |
|||||
| Public school | 95889 |
45 |
15 |
4 |
24 |
| Private school |
22153 |
6 |
0 | 0 |
6 |
| Not Enrolled In School |
1074856 |
1886 |
336 |
237 |
783 |
1990
AGE STRUCTURE
| STATE |
COUNTY |
CITY |
|||
| Years of Age | Nebraska |
Garden | Arthur | Lewellen |
Oshkosh |
| 0 to 6 |
169,371 | 228 | 45 |
29 | 93 |
| 7 to 18 |
282,321 |
375 |
81 |
30 |
134 |
| 19 to 24 | 130,644 |
101 | 17 |
14 |
52 |
| 25 to 39 |
384,114 | 454 | 106 |
34 | 176 |
| 40 to 64 |
388,869 |
711 |
128 |
78 |
229 |
| 65 to 84 |
194,653 | 503 |
79 |
70 |
280 |
| 85 and Over | 28,413 |
88 |
6 |
43 |
41 |
Source: http://venus.census.gov
1990 NUMBER OF
HOUSEHOLDS
| STATE |
COUNTIES |
CITIES |
|||
| Nebraska |
Garden |
Arthur | Lewellen |
Oshkosh |
|
| Urban |
1,044,008 |
0 |
0 |
0 | 0 |
| Rural |
534,377 |
1,046 |
186 |
298 |
1005 |
| Farm |
117,658 |
558 |
254 |
11 | 0 |
| Nonfarm |
416,719 | 1,902 |
208 |
287 |
1005 |
| Total |
1,578,385 |
1,046 |
186 |
298 |
1005 |
HOUSEHOLD INCOME IN
1989
| STATE |
COUNTY |
CITY |
|||
| Income |
Nebraska |
Garden | Arthur |
Lewellen | Oshkosh |
| $5,000 to $24,999 | 288,717 | 664 |
130 |
100 |
320 |
| $25,000 to $39,999 |
127,277 |
222 |
35 |
28 | 84 |
| $40,000 to $59,999 | 103,052 | 108 | 16 |
13 |
31 |
| $60,000 to $99,999 | 46,146 | 65 |
5 |
0 |
12 |
| $100,000 to
$149,999 |
8,307 |
0 | 0 |
0 | 0 |
| $150,000 or more |
5,077 |
3 |
0 |
0 |
3 |
| STATE |
COUNTY |
CITY |
|||
| Nebraska |
Garden | Arthur |
Lewellen | Oshkosh |
|
| Wage Or Salary |
|||||
| With Wage Or Salary | 465,731 |
687 |
140 |
81 |
281 |
| No Wage Or Salary
Income |
137,127 |
359 |
46 |
60 |
169 |
| Nonfarm Self-Employment |
|||||
| With Nonfarm
Self-Employment |
82,122 | 122 |
38 |
20 |
49 |
| No Nonfarm
Self-Employment |
520,736 | 924 |
148 | 121 |
401 |
| Farm Self-Employment |
|||||
| With Farm
Self-Employment |
57,524 |
283 |
72 |
15 |
34 |
| No Farm
Self-Employment |
545,334 |
763 |
114 |
126 |
416 |
| STATE |
COUNTY |
CITY |
|||
| Industry |
Nebraska |
Garden | Arthur | Lewellen |
Oshkosh |
| Agriculture, Forestry, and Fisheries | 64,381 |
117 |
15 |
34 | |
| Mining |
2,095 | 0 | 0 |
0 | 0 |
| Construction |
40,821 |
32 |
7 |
7 | 21 |
| Manufacturing,
Nondurable Goods |
47,720 |
31 |
6 |
0 | 4 |
| Manufacturing,
Durable Goods |
50,624 |
123 |
4 | 19 | 91 |
| Transportation,
Communications, and Other Public Utilities |
62510 |
30 | 7 | 9 | 10 |
| Wholesale Trade | 35,726 |
5 | 2 | 0 | 3 |
| Retail
Trade |
138,179 |
154 | 22 | 17 | 72 |
| Finance,
Insurance, And Real Estate |
52,137 |
15 | 8 | 3 | 6 |
| Services | 278,620 |
151 | 45 | 42 | 169 |
228
7 to 9 years...............................................................99
10 and 11 years............................................................69
12 and 13 years............................................................79
14 years...................................................................23
15 years...................................................................26
16 years...................................................................19
17 years...................................................................31
18 years...................................................................29 375
19 years...................................................................14
20 years...................................................................39
21 years...................................................................13
22 to 24 years.............................................................35
101
25 to 29 years............................................................139
30 to 34 years............................................................163
35 to 39 years............................................................152
454
40 to 44 years............................................................149
45 to 49 years............................................................154
50 to 54 years............................................................120
55 to 59 years............................................................159
60 and 61 years............................................................44
62 to 64 years.............................................................85
711
65 to 69 years............................................................137
70 to 74 years............................................................156
75 to 79 years............................................................104
80 to 84 years............................................................106
503
85 years and over..........................................................88
Behrents, William. 1999. Interview. Refuge Manager, Crescent Lake National Wildlife Refuge, Alliance, Nebraska.
Bleed, Ann and Charles Flowerday, ed., second edition. 1990. An Atlas of the Sand Hills.
Conservation and Survey Division Institute of Agriculture and natural
Resources: University of Nebraska-Lincoln.
Bleed, Ann and Marilyn Ginsberg. 1990. Lakes and Wetlands. An Atlas of the Sand
Hills. Conservation and Survey Division Institute of Agriculture and natural
Resources: University of Nebraska-Lincoln.
Borchert, John R. 1971. The Dust Bowl in the 1970s. Annals of the Association of
American Geographers, v61:1.
Borchert, John R. 1950. The Climate of the Central North American Grasslands. Annals
of the Association of American Geographers, v11:1.
Bowden, Martyn. 1977. Desertification of the Great Plains, Will it Happen? Annals of
the Association of American Geographers, v53:4.
Fenneman, Nevin M. 1931. Physiography of Western United States. McGraw-Hill
Book Company, Inc.: New York and London.
Freeman, Patricia. 1990. Mammals. An Atlas of the Sand Hills. Conservation
and Survey Division Institute of Agriculture and natural Resources: University of
Nebraska-Lincoln.
La Grange, Ted. 1997. Guide to Nebraska’s Wetlands and their conservation needs.
Nebraska Games and Parks Commission: Lincoln, NE.
Lewis, David T. 1990. Origins of Sand Hills Soils. An Atlas of the Sand Hills.
Conservation and Survey Division Institute of Agriculture and natural Resources:
University of Nebraska-Lincoln.
McIntosh, Charles Barron. 1996. The Nebraska Sand Hills: the Human Landscape.
University of Nebraska Press: Lincoln and London.
Miller, Susan M. 1990. Land Development and Use. An Atlas of the Sand Hills.
Conservation and Survey Division Institute of Agriculture and natural Resources:
University of Nebraska-Lincoln.
Nebraska State Historical Society. 1998. Sheridan County: Nebraska Historic Buildings
Survey. Meade Hunt: Nebraska.
Robinson, Arthur, J. Lindberg, and L. Brinkman. 1961. A Correlation and Regression
Analysis applied to Rural Farm Population Densities in the Great
Plains. Annals of the Association of American Geographers, v51.
Roebuck, Paul. 1993. The Buffalo Commons Debate. Focus. The American
Geographical Society: New York
White, Donald A. and Kenneth G. Hubbard. 1990. Climate. An Atlas of the Sand
Hills. Conservation and Survey Division Institute of Agriculture and natural
Resources: University of Nebraska-Lincoln.
http:/pubs.isgs.gov/circular/c1172/h10.html
/svinrt2.fs.fed.us:80/databa...k075/kuchler_type_description.html
/svinrt2.fs.fed.us/land/pubs/ecroregions/ch42.html
/nesen.unl.edu/csd/illustration/ec11/ec11text.html
/www.ks.nrcs.usda.gov/soil/65.htm
/www.chadron.com/fact.html
/refuges.fws.gov/NWRSFiles?RefugeSystemLeaflets/
/www.ianr.unl.edu/ianr/waterct/wetlands.html
/nrcnt2.nrc.stste.ne.us/cgi-win/rainfall.exe/rainfall.exe